About EPFR’s Fund Flows and Allocations Data and Insights
Unparalleled understanding of how money is moving and why
Our best-in-class Fund Flows and Allocations Data helps you reveal the investible truth by looking at market trends, investor sentiment, liquidity, risk signals and corporate actions, and can be tailored to your specific use case.
$55T+
93%
151K+
$7T+
25+
Primary benefits
Industry-leading timeliness and granularity
Supports both bottom-up and top-down asset allocation strategies
Illustrated analysis of key factors driving current flow trends
Critical insights at macro and stock levels
Unique views on fund manager and investor sentiment
Insight into the fixed Income fund market at a bond ownership and security level
Connecting the dots with EPFR’s Fund Flows
Dating back to 1995, our fund flow data provides as-reported coverage of the net flows into and out of a universe of over 151,000 share classes and more than $55 trillion in assets tracked (AUM), helping our clients reveal the investible truth from:
- Equity Fund Flows
- Bond Fund Flows
- All other major asset classes, including: Money Market Flows, Alternative Fund Flows, and Multi-Asset Flows

Trusted by:
%
of the Bulge Bracket (the world’s largest investment banks)
%
of the “top 20” global asset management firms (by AUM)
%
of the Bulge Bracket (the world’s largest central banks)
%
of the “top 20” global asset mgmt firms (by AUM)
Latest Insights
Thought leadership and analysis that help you find a signal in the noise
Bears claw Japan in late May
EPFR-tracked Japan Equity Funds suffered record-setting redemptions during the fourth week of May as another underwhelming Japanese government bond auction prompted investors to cut their exposure.
Thailand and ASEAN Economic Resilience Amid US Tariffs
Our latest on-demand video – “Thailand and ASEAN Economic Resilience Amid US Tariffs” – unpacks the implications of rising tariffs on commodities, currency and investment in ASEAN and Thailand with compelling insights from industry leaders.
Fiscal discipline rears its ugly head in mid-May
The third week of May was marked by lackluster sovereign debt auctions, America being stripped of its final AAA debt rating and angst about the new US administration’s “big and beautiful” tax and spending bill.
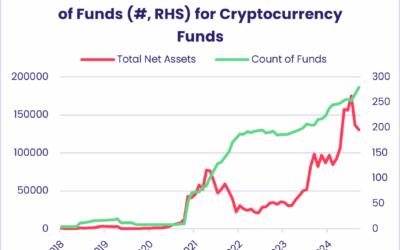
Crypto: Digital gold or fools gold?
In this Quants Corner, we will isolate the return profiles for major cryptocurrencies and see if they provide a sufficiently strong foundation for deeper quantitative dives in the future.


