Specialized flows,
allocations and markets data
Dig deeper with our specialized datasets
Built upon our Fund Flows and Allocations data, our specialized solutions leverage our nearly 25 years of trading experience, enabling buy-side and sell-side clients to:
- Track their overall performance against any benchmarks they may be utilizing
- Better understand investor sentiment, active weighting and behavioral patterns
- Spot which levers to pull in order to improve top-line and bottom-line performance
Core and hybrid datasets
EPFR captures data from thousands of sources worldwide and is released following a 24-hour production cycle.
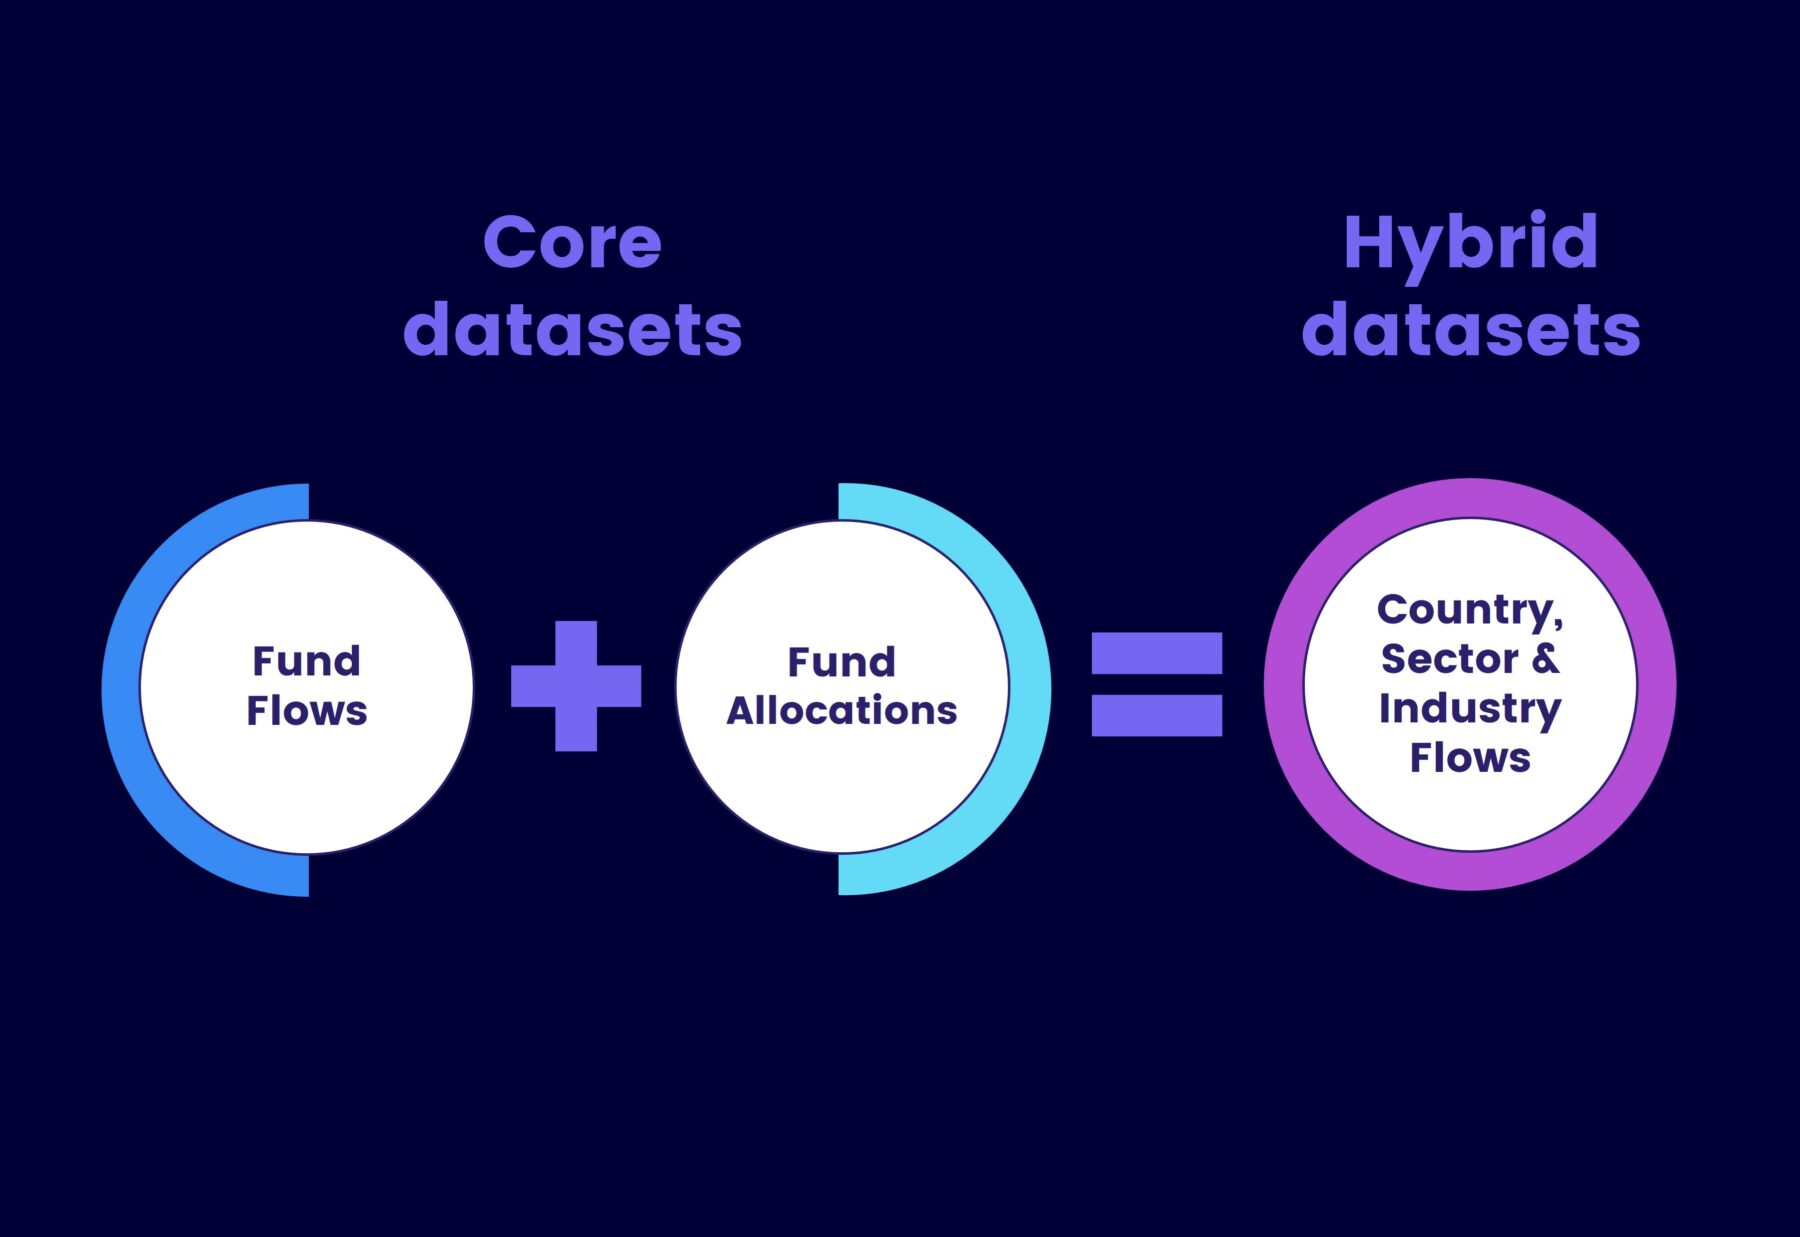
To ensure clients really get the investible truth, EPFR data is available in a variety of core and hybrid datasets:
- Core datasets are based on data directly sourced from Fund Managers and Administrators
- Hybrid datasets combine EPFR’s Fund Flows and Allocations data to give you a deeper understanding of how money is moving across geographies, sectors, industries, and stocks.
Our specialized solutions
Empty
Your content goes here. Edit or remove this text inline or in the module Content settings. You can also style every aspect of this content in the module Design settings and even apply custom CSS to this text in the module Advanced settings.
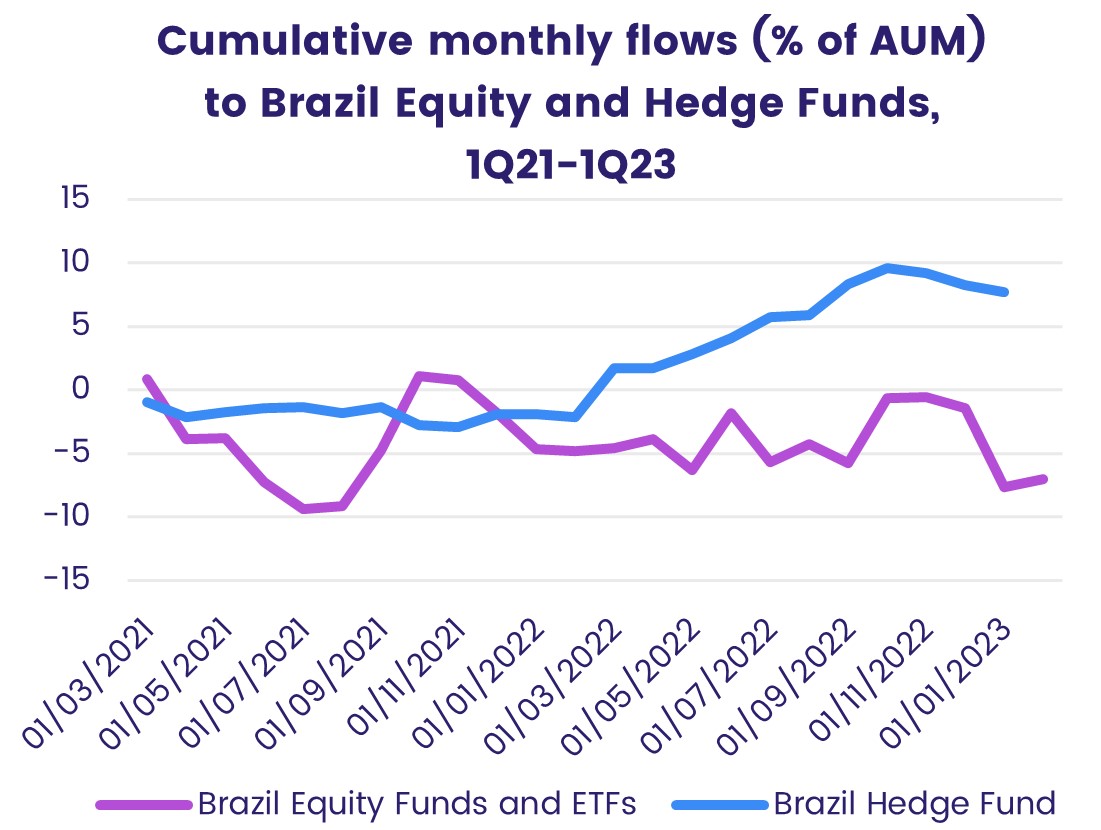
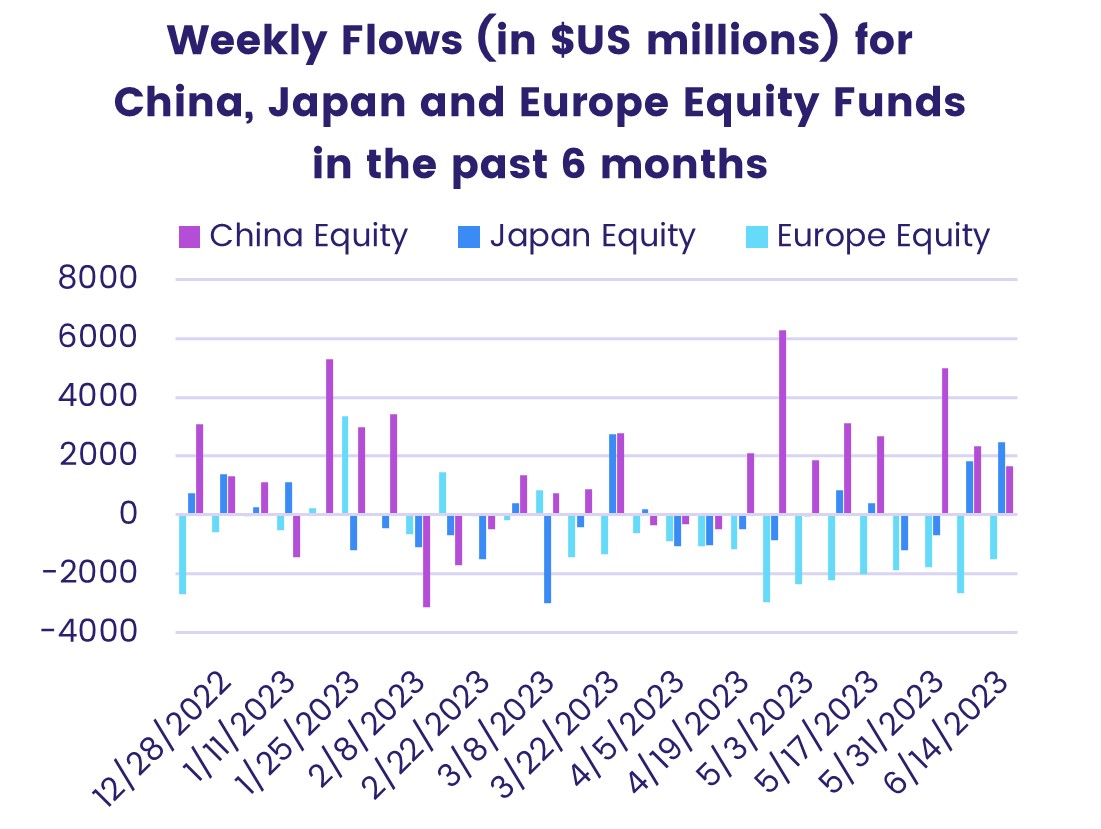
Hedge Fund Flows
Better understand investor sentiment and hedge fund activity with this combined database, created in partnership with Backstock BarclayHedge.
- Coverage: history dating back to 2010, tracking over 3,500 Hedge Funds and Commodity Trade Advisors and roughly $1.7 trillion in AUM
Empty
Your content goes here. Edit or remove this text inline or in the module Content settings. You can also style every aspect of this content in the module Design settings and even apply custom CSS to this text in the module Advanced settings.
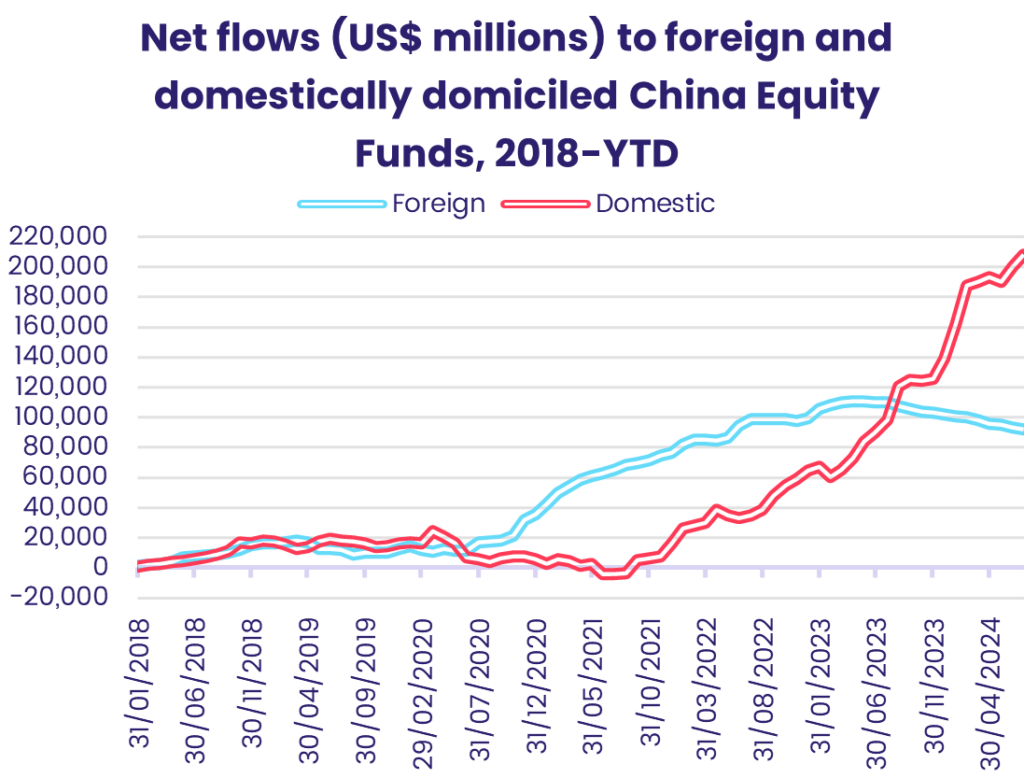
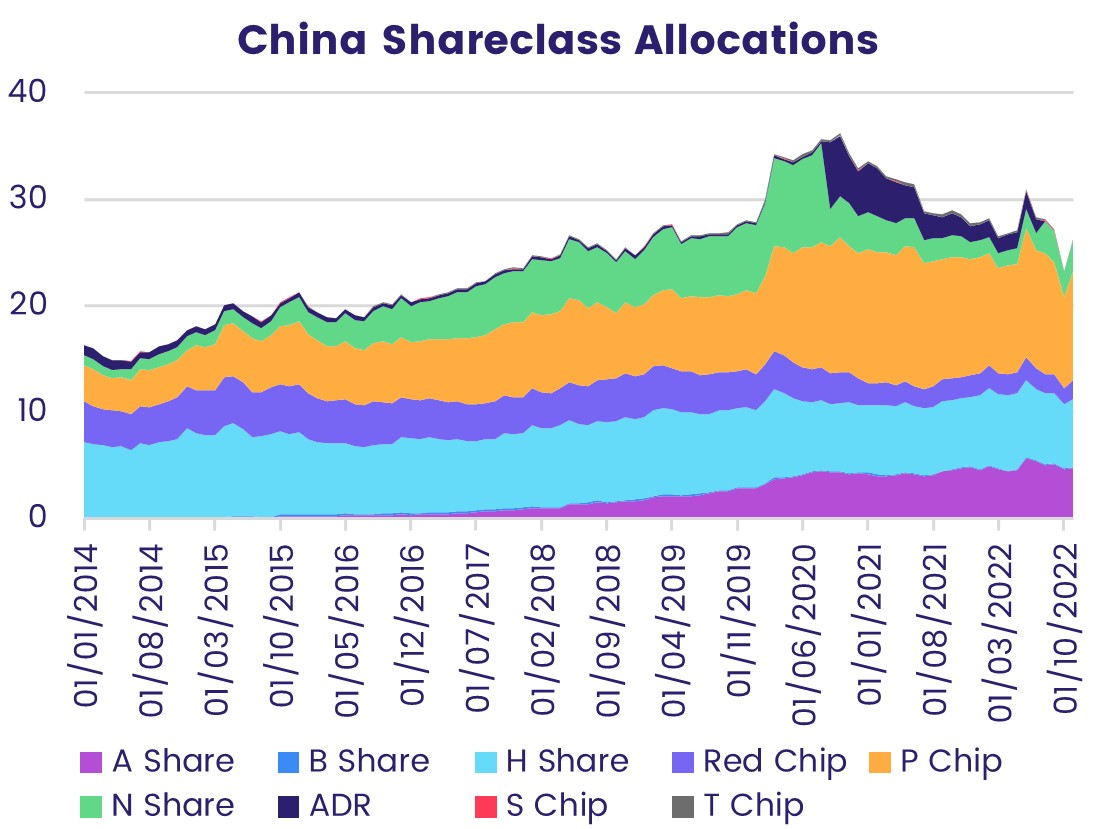
China Share Class Allocations
Our dataset covers 9 share classes, and draws from a universe of funds that include dedicated China, Greater China, Pacific Regional, Global, Global Emerging Markets (GEM), and Asia ex-Japan regional equity funds.
- Share classes included: A, B, H and N Shares, Red Chips, P, S, and T Chips, and ADRs
- Coverage: over $3 trillion in assets
Empty
Your content goes here. Edit or remove this text inline or in the module Content settings. You can also style every aspect of this content in the module Design settings and even apply custom CSS to this text in the module Advanced settings.
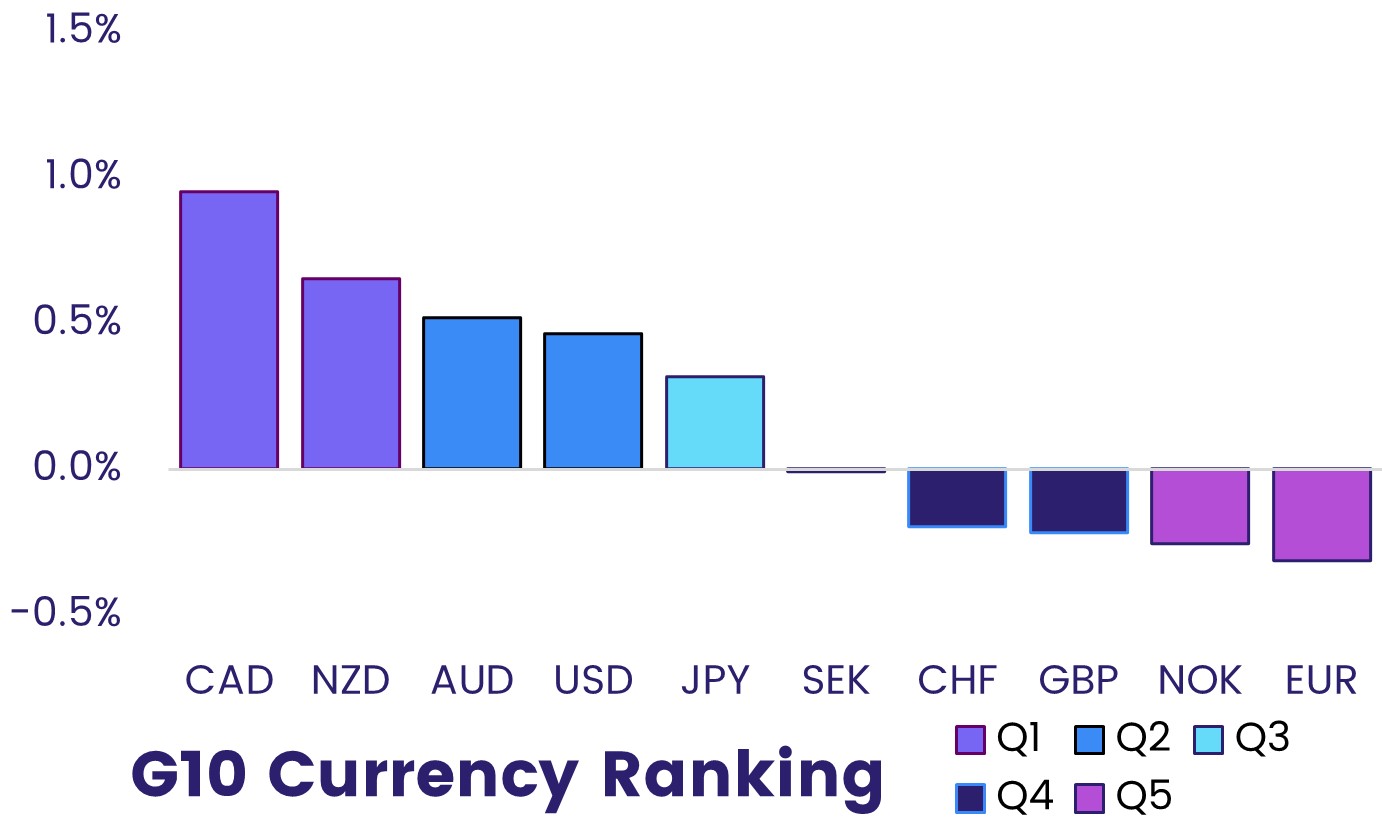
FX Allocations
- Coverage: over $4.2 trillion in assets
Empty
Your content goes here. Edit or remove this text inline or in the module Content settings. You can also style every aspect of this content in the module Design settings and even apply custom CSS to this text in the module Advanced settings.
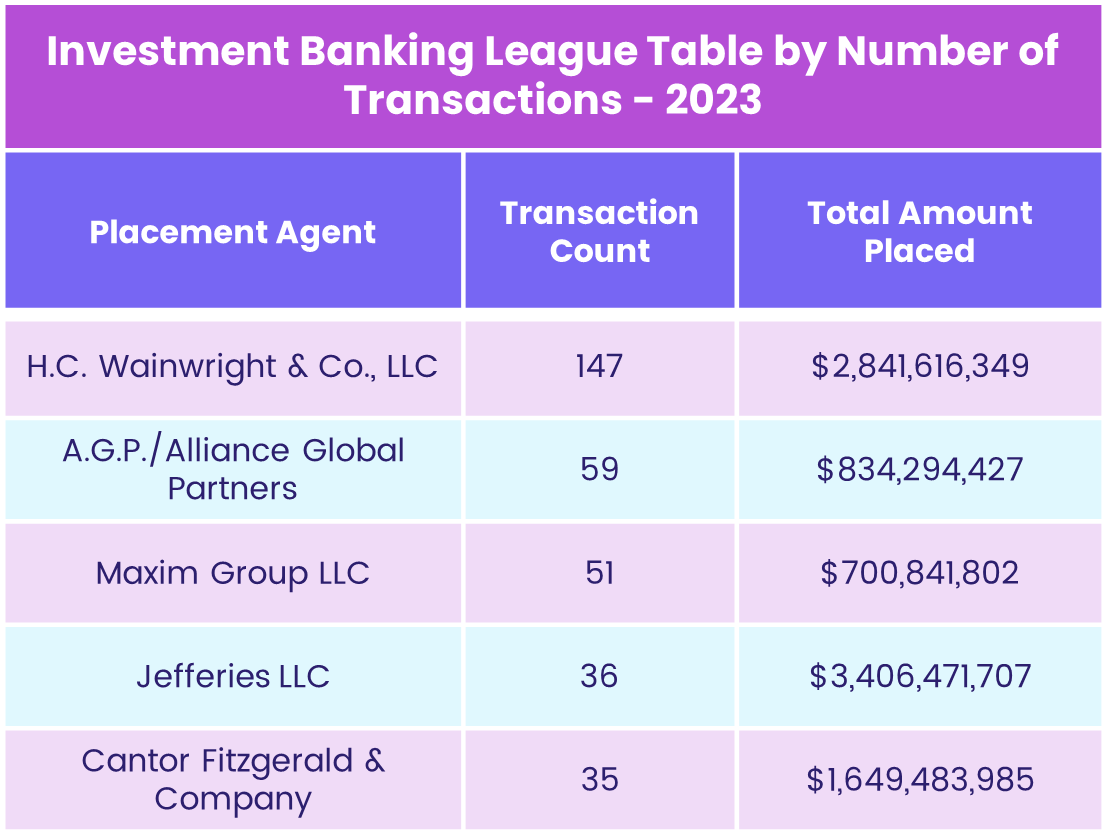
PIPE & Private Placement Markets (PlacementTracker)
Our interactive database includes over:
- 50,000 transaction profiles
- 2,700 placement agents
- 15,000 investor profiles
- 1,200 legal counsel profiles.
Empty
Your content goes here. Edit or remove this text inline or in the module Content settings. You can also style every aspect of this content in the module Design settings and even apply custom CSS to this text in the module Advanced settings.
Liquidity Research
The key premise of our approach is that stock prices are a function of liquidity. Like the prices of any tradable good, the prices of stocks are driven by supply and demand. We track three main types of US data:
- Fund Flows (Demand)
- Corporate actions (Supply)
- Macroeconomic data
Empty
Your content goes here. Edit or remove this text inline or in the module Content settings. You can also style every aspect of this content in the module Design settings and even apply custom CSS to this text in the module Advanced settings.
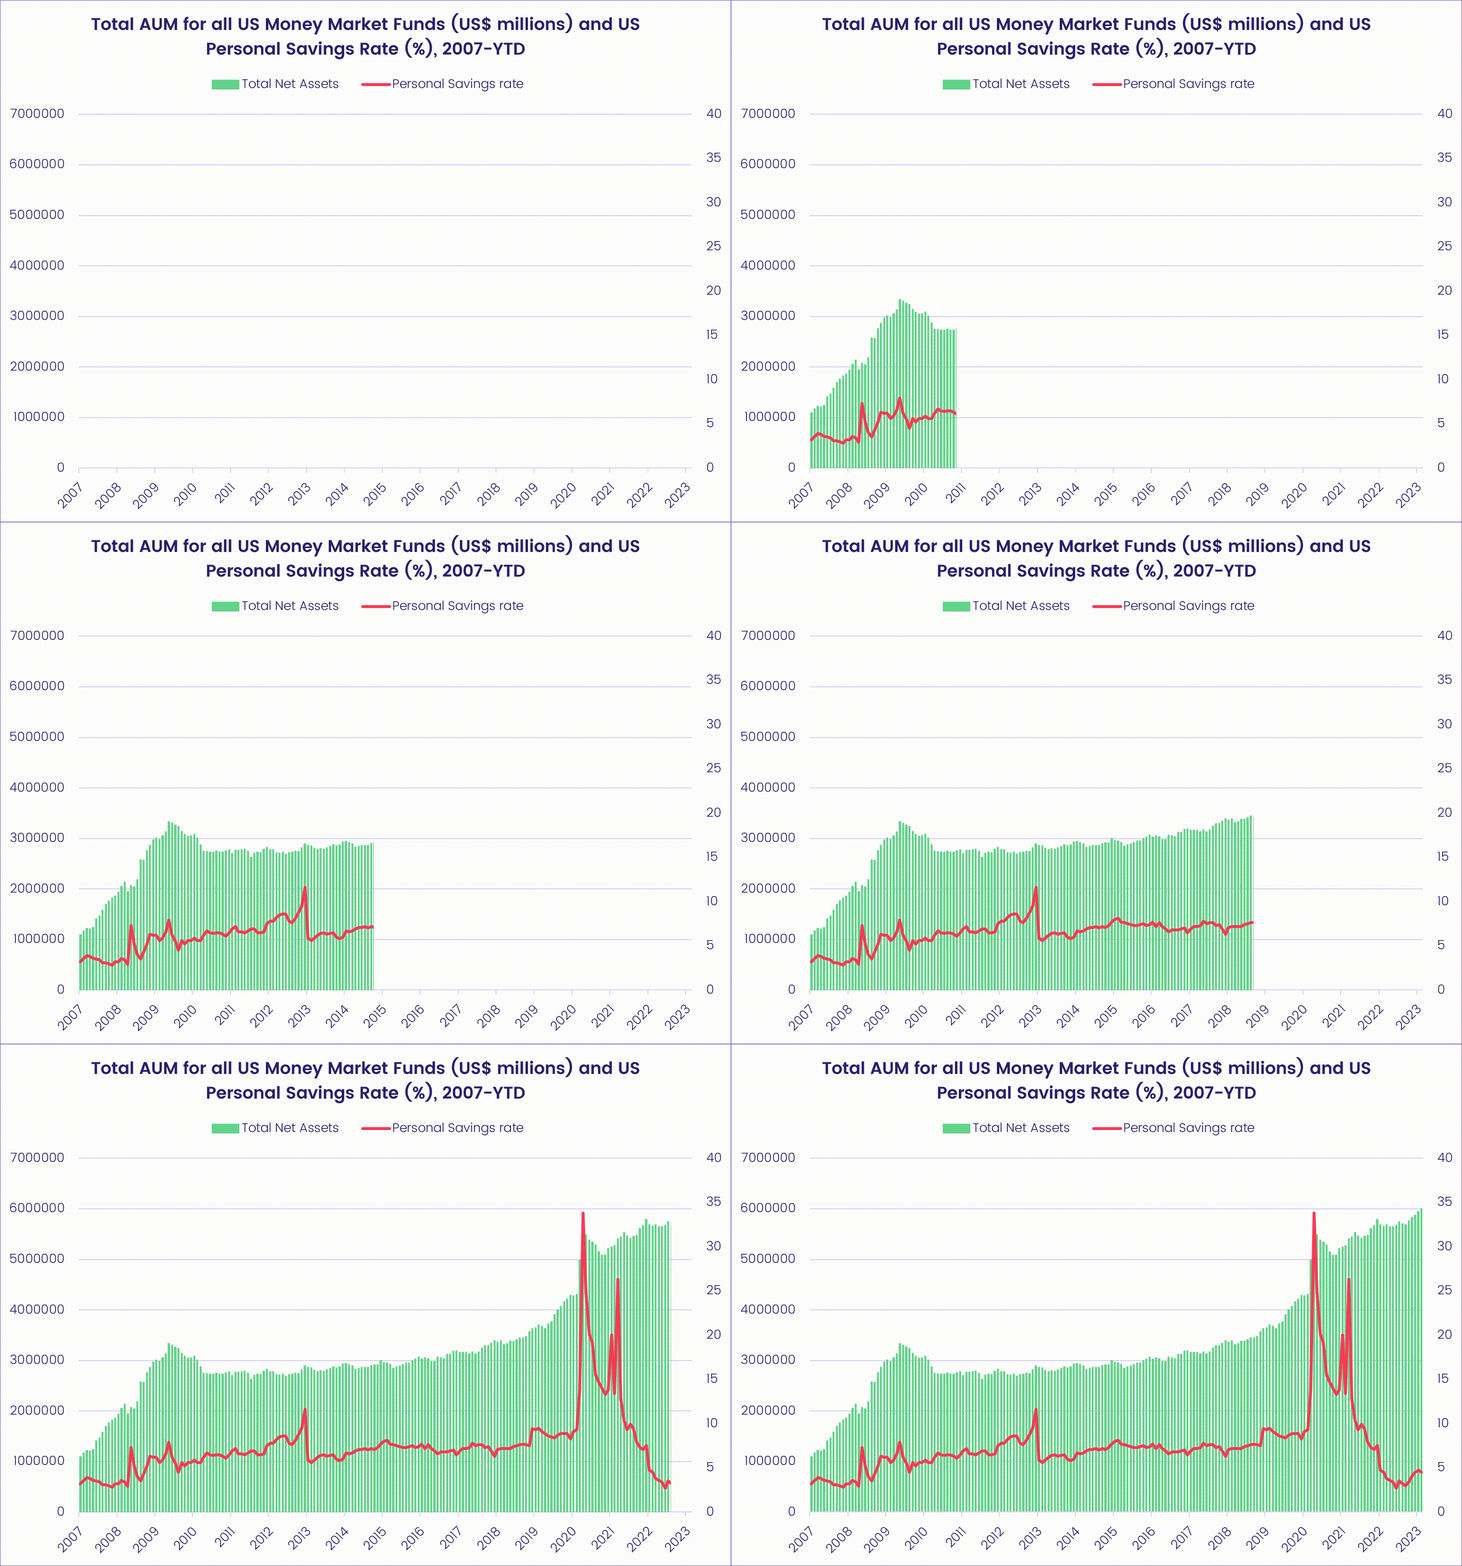
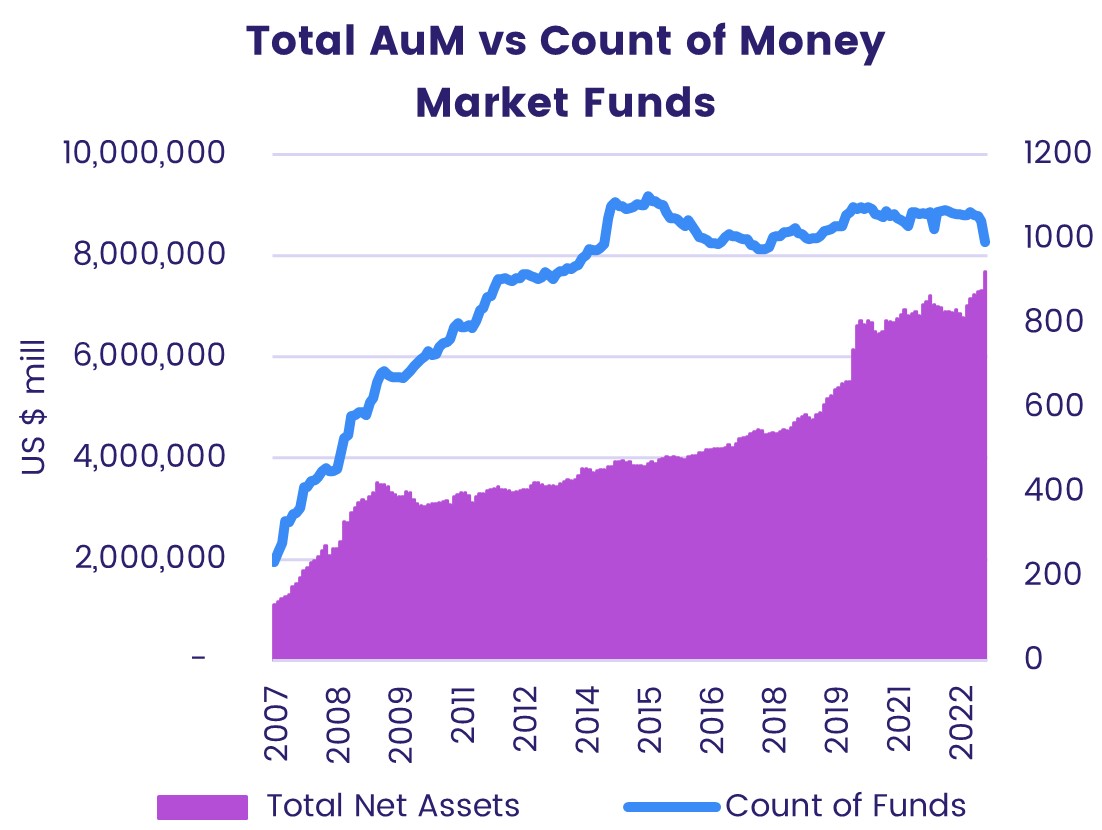
Money Market Flows
EPFR offers two windows into Money Market Fund flows and allocations:
- Flow data from 2007 onwards for a broad universe of funds domiciled globally; this data can be run through a number of EPFR’s standard filters.
- Our specialist iMoneyNet solution offers a more granular look at a smaller universe that mainly covers the US and Europe, also covering separate ultra-short-term Bond Funds on a separate dataset. Some of iMoneyNet’s data has history dating back to the 1970s.
“EPFR’s data will tell you what is happening from one region to another, meaning that you can better understand investor sentiment.”
Kenneth Chan, SVP Global Quantitative Strategist – Jefferies Hong Kong Limited
Specialized flows, allocations and markets data – FAQs
What are specialized funds?
Also known as ‘sector funds’ or ‘sectoral funds’, specialized funds are mutual funds or Exchange-Traded Funds (ETFs) investing in securities from very specific industries, commodities, sectors or regions. An example of specialized fund could be China ETF A Shares, as it tracks domestic Chinese equities trading on either the Shenzhen or Shanghai Stock Exchange.
EPFR’s fund flows and asset allocations data provides our clients with access to a privileged view of the underlying investor demand for different asset classes, themes, currencies, industries and geographies. By relying on datasets with 25 years of history in some cases, you can spot key investor sentiment trends and put them in a more accurate historical context.
Our Latest Insights
Market Insights: Searching for an anchor: Market sentiment towards China
Another vote for divided government?
