Security-level flows data
The granularity you need to make better decisions
Get a privilege view into the ownership of, and demand for, more than 20,000 stocks and over 50,000 individual bonds and fixed-income securities, supporting multiple buy-side and sell-side use cases, including:
- Active and passive management
- Quantitative or systematic investment strategies
- Debt capital markets
- Sales and trading
- And more

Core and hybrid datasets
EPFR captures data from thousands of sources worldwide and is released following a 24-hour production cycle.
To ensure clients really get the investible truth, EPFR data is available in a variety of core and hybrid datasets:
- Core datasets are based on data directly sourced from Fund Managers and Administrators
- Hybrid datasets combine EPFR’s Fund Flows and asset allocations data to give you a deeper understanding of how money is moving across geographies, sectors, industries, and stocks.

Our solutions

Stock Flows and Allocations
Stock Flows provide estimates of the flows into a given stock by multiplying the monthly flow into a fund by the last available holdings data. This calculation is repeated for all funds tracked by EPFR and summed into an aggregated figure for over 20,000 individual stocks.
Stock Allocations data, on the other hand, measures the average allocation to a given stock within a specific fund group.

Stock Barometer
EPFR’s Stock Barometer is a tabular form visualization of the Stock Allocations data which captures relevant factors based on the composition of major indexes, such as the S&P 500, Sensex, etc.

Fixed-Income Flows and Holdings
Launched in 4Q21, this dataset captures a view into the ownership of, and demand for, more than 50,000 individual sovereign, corporate and other bonds and fixed income securities.
Utilizing the holdings from a subset of the overall universe of mutual funds and ETFs tracked by EPFR, the dataset aggregates on a daily, weekly and monthly basis:
- the total value of the holdings for each specific ISIN
- calculates the flows in and out of over 50,000 different securities
“The insight that we receive from EPFR has been, and continues to be, really helpful in aiding our roles as DCM advisors.”
Financial Services Provider – EPFR client since 2015
Security-level flows data – FAQs
How can EPFR data help me improve the timing of my position’s entry and exit points?
EPFR data can be used to monitor derived security-level flow data, allowing you to observe pricing pressure on stock prices driven by mutual funds and Exchange-Traded fund flows.
Can EPFR help me prioritize my daily outreach in a better way?
Yes, it can. Clients using our Premium Daily Report get detailed access to flow data at Manager and Fund level, enabling them to structure their day around the customers with the biggest flows.
Our Latest Insights

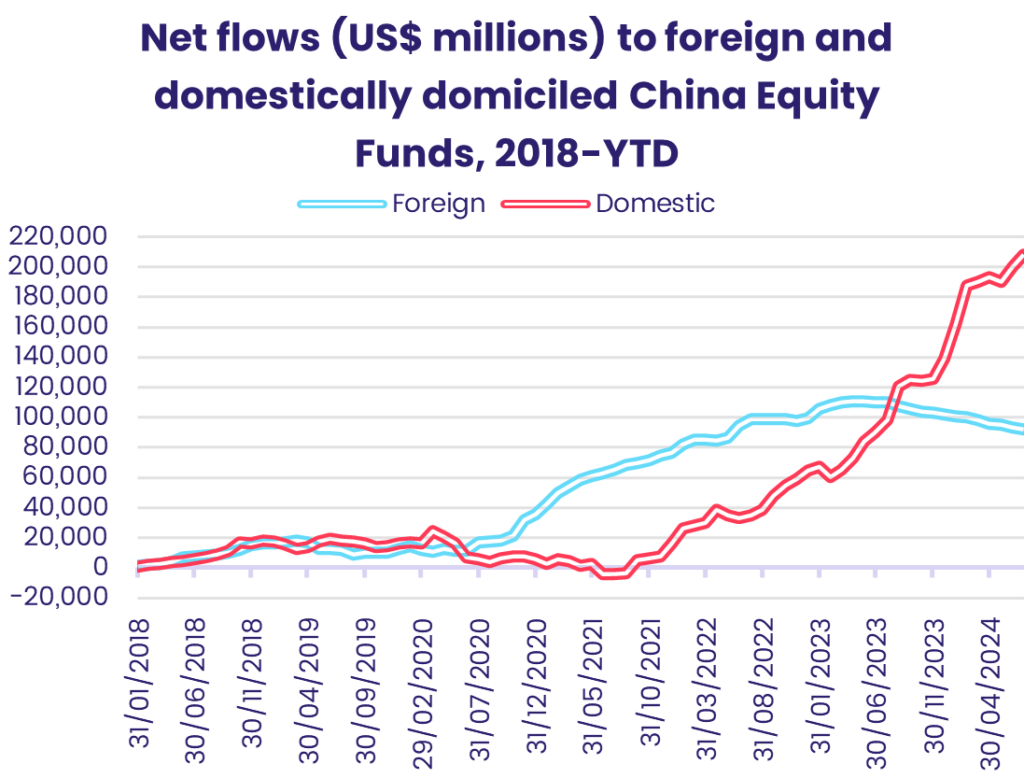
Market Insights: Searching for an anchor: Market sentiment towards China

Another vote for divided government?