Fund flows and
asset allocations data
Unparalleled understanding of how money is moving and why
EPFR’s Fund Flows and Allocations data combines best-in-class granularity with a comprehensive coverage of over 150,000 share classes, comprising $50 trillion in assets tracked (AUM). Every day, we support buy-side and sell-side teams with the intelligence they need to better assess:
- Their overall performance against any benchmarks they may be utilizing
- Investor sentiment, active weighting and behavioral patterns
- Which levers to pull in order to improve top-line and bottom-line performance

Core and hybrid datasets
EPFR captures data from thousands of sources worldwide and is released following a 24-hour production cycle.
To ensure clients really get the investible truth, EPFR data is available in a variety of core and hybrid datasets:
- Core datasets are based on data directly sourced from Fund Managers and Administrators
- Hybrid datasets combine EPFR’s Fund Flows and Allocations data to give you a deeper understanding of how money is moving across geographies, sectors, industries, and stocks.

Asset classes covered by EPFR

Empty
Your content goes here. Edit or remove this text inline or in the module Content settings. You can also style every aspect of this content in the module Design settings and even apply custom CSS to this text in the module Advanced settings.
Equity Fund Flows
Get access to over 22,000 share classes, with over $28 trillion in AUM and history stretching back to 1996. It captures all Developed and Emerging Markets Equity Funds and ETFs, and is organized by geographic mandate, offering clients multiple filtering options, including:
- Capitalization
- Sector
- Style
- Fund domicile
- Applicable themes (SRI/ESG, leveraged, dividend, etc.)

Empty
Your content goes here. Edit or remove this text inline or in the module Content settings. You can also style every aspect of this content in the module Design settings and even apply custom CSS to this text in the module Advanced settings.
Bond Fund Flows
With history dating back to 2002, our Bond Funds dataset encompasses over 10,500 funds managing combined total assets of nearly $10 trillion, allowing you to further filter by:
- Corporate vs Sovereign
- Currency
- Duration
- State
- Quality
- Style
- Relevant themes (domicile, currency of flows, SRI/ESG, etc.)

Empty
Your content goes here. Edit or remove this text inline or in the module Content settings. You can also style every aspect of this content in the module Design settings and even apply custom CSS to this text in the module Advanced settings.
Money Market Flows
EPFR offers two windows into Money Market Fund flows and allocations:
- Flow data from 2007 onwards for a broad universe of funds domiciled globally; this data can be run through a number of EPFR’s standard filters.
- Our specialist iMoneyNet solution offers a more granular look at a smaller universe that mainly covers the US and Europe, also covering separate ultra-short-term Bond Funds on a separate dataset. Some of iMoneyNet’s data has history dating back to the 1970s.

Empty
Your content goes here. Edit or remove this text inline or in the module Content settings. You can also style every aspect of this content in the module Design settings and even apply custom CSS to this text in the module Advanced settings.
Alternative Fund Flows
Tracking over 2,500 funds that collectively manage nearly $600 billion in assets, our Alternative Funds data allows you to filter by:
- Commodities/Materials
- Currency Funds
- Convertible Bond Funds
- Long/Short Funds
- Long Physical Commodities
- Short Physical Commodities
- Key filters include gold and other precious metals, cryptocurrency and bear funds.
 data")
Empty
Your content goes here. Edit or remove this text inline or in the module Content settings. You can also style every aspect of this content in the module Design settings and even apply custom CSS to this text in the module Advanced settings.
Multi-Asset (Balanced) Fund Flows
Track the flows into and out of a universe of funds that invest in both equity and bonds.
The total net assets for EPFR-tracked Multi-Asset Funds stand at $3 trillion, with historical data going back to 1998.
Discover how to view Multi-Asset Funds by low, mid and high risk in this Quants Corner by EPFR’s CIO, Sayad Baronyan:
EPFR subset datasets

Empty
Your content goes here. Edit or remove this text inline or in the module Content settings. You can also style every aspect of this content in the module Design settings and even apply custom CSS to this text in the module Advanced settings.
Country Flows and Allocations
EPFR’s country-level solutions include Country Allocations and its proprietary dataset for Country Flows.
- Country Allocations shows the average fund exposure by country
- Country Flows combines Fund Flows and Country Allocations to show total flows into a specific country

Empty
Your content goes here. Edit or remove this text inline or in the module Content settings. You can also style every aspect of this content in the module Design settings and even apply custom CSS to this text in the module Advanced settings.
Sector Flows and Allocations
EPFR’s sector-level solutions include Sector Allocations and its proprietary dataset for Sector Flows.
- Sector Allocations shows the average fund exposure by country
- Sector Flows combines Fund Flows and Sector Allocations to show total flows into a specific country

Empty
Your content goes here. Edit or remove this text inline or in the module Content settings. You can also style every aspect of this content in the module Design settings and even apply custom CSS to this text in the module Advanced settings.
Industry Flows and Allocations
EPFR’s industry-level solutions include Industry Allocations and its proprietary dataset for Industry Flows.
- Industry Allocations shows average fund exposure by country
- Industry Flows combines Fund Flows and Industry Allocations to show total flows into a specific country

Empty
Your content goes here. Edit or remove this text inline or in the module Content settings. You can also style every aspect of this content in the module Design settings and even apply custom CSS to this text in the module Advanced settings.
Pre-Market Fund Flow Data
EPFR’s Early Edge Fund Flows offers the most-timely fund level and aggregate flow report available in the market. Harness previous day’s trading data just four hours after the US market closure to be first and move faster
- Spot pivotal fund flow and investor sentiment trends
- Unlock new business growth opportunities
“If you are a macro-strategy team, EPFR is a must.
I don’t think there is a better flow and allocation data provider in the market.”
Financial Services Provider – EPFR client since 2015
Fund Flows and Asset Allocations – FAQs
What do you mean by ‘fund flow’?
Fund Flows, or “asset flows”, track the direction of money into or out of assets over a set period of time. Inflows and outflows at the fund level are aggregated to represent net flows for a specific fund group or asset type.
Inflows often signal positive investor sentiment, or growing confidence from investors in that asset. Outflows often signal negative investor sentiment, or a decline in confidence.
EPFR’s Fund Flows and Allocations data provides clients with over 25 years of history for some datasets, allowing them to spot key investor sentiment trends and interpret market shifts in an accurate historical content.
How can I use EPFR’s fund flow data for my country selection?
Our market-leading data provides empirical evidence of which countries are seeing investments or divestments.
Can EPFR data help me assess whether my decisions are contrarian or consensus with the market?
EPFR provides clients with macro and granular data, and customized reports to capture specific views of investor sentiment. Most commonly, the filtering of active management relative to passive investment strategies. Our quantitative research team has also developed a slate of factors and strategies, some of which are successful contrarian indicators (i.e.: FX Shares Surprise).
Where does EPFR get its fund flows and asset allocations data from?
EPFR collects data from several thousand open-end sources around the globe (including Mutual Funds, UCITS, SICAVs, Variable Annuity Funds, Insurance-linked Funds, and -more recently- Collective Investment Trusts or CITs), as well as closed-end, interval, and exchange-traded products with a 24-hour production cycle, using a proprietary collection and thorough quality control processes.
How can EPFR’s filtering options help me with my job?
The multiple filtering options offered by EPFR allow our clients to better assess medium and long-term market trends.
You can slice and dice the data to pick out relevant filters, such as flows into investment grade versus high yield bond funds, and active versus passive flows.
Would you like to see our filtering options in action? Request a demo with one of our specialists today!
Can EPFR help me assess the daily general market direction?
Yes. EPFR’s Pre-Market Fund Flow Data provides the most-timely aggregate fund flow report available, showing at or pre-market flows on a T+1 basis.
You might also find useful a recent EPFR insight written by our Quants team: ‘Early-release flow data: jumping on a bandwagon?’
Can I customize the fund flow data to meet my needs?
The plethora of filtering options offered by EPFR allow clients to better assess historical short and long-term market trends and narrow down on a specific asset class.
Broadly speaking, clients have the ability to slice and dice between Exchange Traded Funds (ETFs) and mutual funds, retail vs institutional investors, active vs passive, and by domicile, currency or benchmark. At a more granular level, each asset class has another layer of filtering options. Examples of this include: Sector and Cap for Equities, Corporate vs Sovereign Bonds, etc.
Would you like to see our filtering options in action? Request a demo with one of our specialists today!
Can EPFR help me assess market trends on a daily basis?
How can your Quantitative strategies benefit from using Early Edge Fund Flows? Take a look at our research: ‘Early-release flow data: jumping on a bandwagon?’
How can EPFR's fund flows data help in investment decision-making?
EPFR’s fund flows data serves as a critical tool for investors by revealing the dynamics of capital movements across markets and asset classes. By analyzing patterns of inflows and outflows, investors can gauge market sentiment and anticipate potential price movements, thereby aligning their strategies with prevailing trends or identifying contrarian opportunities.
This data also helps in assessing the popularity of certain sectors or regions, enabling more informed asset allocation decisions that are responsive to real-time market conditions.
What makes EPFR's fund flows and allocations data unique in the market?
EPFR stands out in the market for its depth, breadth, and accuracy. With data coverage of over 151,000 share classes and $55 trillion in assets tracked, our datasets offer unmatched granularity and comprehensiveness.
EPFR’s unique hybrid datasets combine core data sourced directly from fund managers with enriched allocations data, providing a holistic view of global money movements not available from other providers. This enables our clients to tap into detailed insights across multiple sectors, industries, and geographies, tailored to their specific needs.
Our Latest Insights

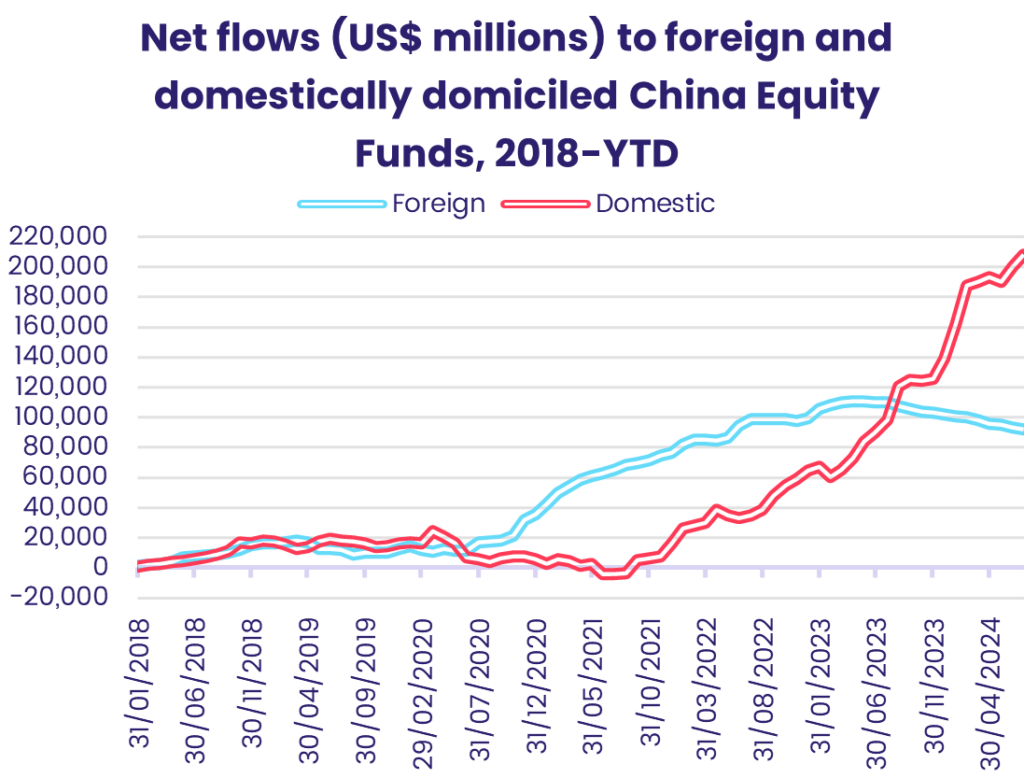
Market Insights: Searching for an anchor: Market sentiment towards China

Another vote for divided government?