This week, in Quants Corner, we will be looking at how EPFR Flow and Allocation Data can help answer some of the more difficult questions in the Asset Management segment:
- How do active managers decide in which country to invest?
- What factors are more explanatory in the long-term?
- How should we decide to give different weights to long-term views vs short-term views?
To understand the explanatory factors of changes in decisions of fund managers historically, we first need either ‘allocation’ or ‘positioning’ data. Second, we need a benchmark to compare this data to understand if the fund managers have a ‘positive’ or ‘negative’ view. In addition, utilising EPFR’s granular country allocation database, we can differentiate ‘active managers’ and ‘passive managers’. We can use passive manager allocations as benchmarks and look at the average weight difference between active and passive managers – enabling us to capture changes in decisions made by fund managers.
How do active managers decide in which country to invest?
The weight difference between active and passive managers and its change through time could indicate the major drivers of country allocations. For example, with US Equities, the average manager had an overweight after the sell-off in December-2018. That overweight has since been decreasing.
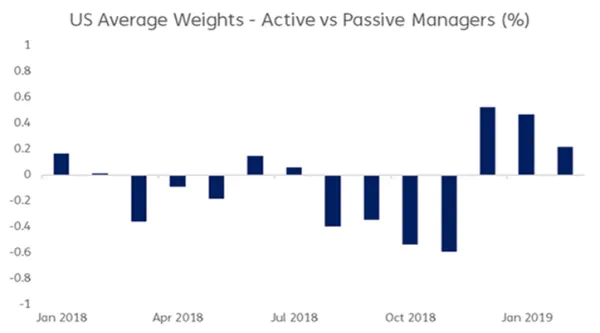
Using EPFR’s country allocation database we can reach out to global country allocations of cross-border equity funds for more than 50 countries. Plotting and understanding the appetite toward a single country might be straightforward – but analysing 50 countries simultaneously is a complex calculation. To understand the main drivers of changes in weights, we run a simple principal component analysis and compare the main factors with some macroeconomic and financial variables.
What factors are more explanatory in the long-term?
The first principal component – which explains up to 60 percent of the total variation in active vs passive country allocations is positive correlated to overweight in EM vs DM. When we plot this first principal component with EM vs DM growth differential through time we find a positive correlation of more than %60 (Figure 1). The growth expectations of single countries seem to be a major driver in shifting country allocations of active managers.
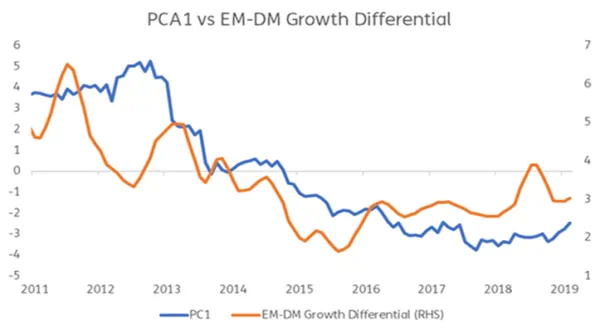
Figure 1
The second principal component – which explains up to 17 percent of the total variation in active vs passive country allocations is positive correlated with G10 rates. When we plot this second principal component with average G10 long-term rates through time we find a positive correlation of more than %50 (Figure 2). Inflation expectations, central bank decisions and other movers of long-term rates probably interacts with the decisions of active managers through this channel.
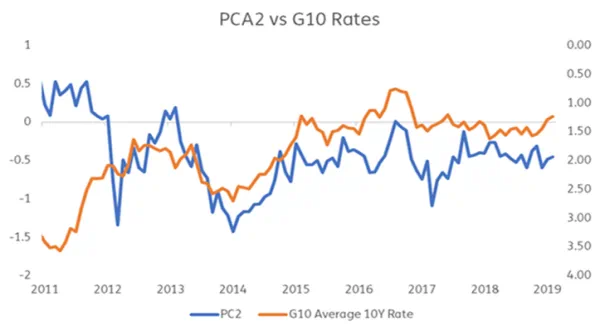
Figure 2
The third principal component – which explains up to 7 percent of the total variation in active vs passive country allocations is positive correlated with the overall risk appetite. When we plot this third principal component with CBOE VIX Index through time we find a positive correlation (Figure 3). However, VIX tends to be a shorter term factor when we compare it with growth or rate expectations.

Figure 3
How should we decide to give different weights to long-term views vs short term views?
Strategic and tactical asset allocation decisions are complex and generally dependent on many parameters. Using EPFR’s allocation data, we can at least find a quantitative way to spot major decision influencers country equity selection. We can then decide to give different weights and risk budgets to our strategic macroeconomic views vs short term tactical views. According to the analysis in this work, average change in active asset allocation is 70% defined by longer term factors like growth, inflation and long term rate expectations. The rest of the asset allocation is more tactical and dependent on shorter term factors like risk appetite and other idiosyncratic factors.
Did you find this useful? Get our EPFR Insights delivered to your inbox.