Trade talks between the world’s two dominant economies, China and the US, have proceeded inconclusively for the better part of three years. Going into December a firm agreement to resolve the numerous issues dividing the two countries remained elusive, leaving investors scratching their heads as they try to figure out how to extract meaningful signals from the oceans of data, tweets, diplomatic communiques, commentary, and news that the Sino-US trade war generates on a daily, weekly and monthly basis.
From a quantitative perspective, finding a signal when short-term volatility and sentiment are so unstable – both structurally and fundamentally – is also challenging. In the case of EPFR’s quantitative research team, getting a credible signal from our mutual fund flows and allocations database requires drilling deeper than is sometimes necessary.
A simple look at aggregate flows for China and US Equity Funds, presented in Chart 1 below, proves to be of limited value in deciding how best to rotate exposure between the two markets. Both have experienced net redemptions YTD, with US Funds recording the biggest outflow in cash terms but Chinese funds hit harder in flows as a % of AUM terms ( -7.18% YTD).
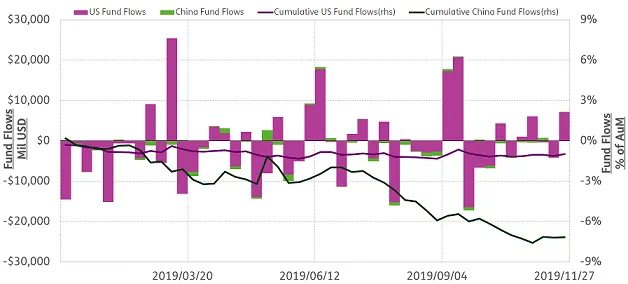
Chart 1 – Weekly Fund Flows (Mil USD) & Cumulative Fund Flows (% of AuM)
If we look at the performance of two ETFs that represent the benchmark for both markets – Chart 2, below – we see an investor will be slightly better off YTD by investing in an A-share ETF even though China funds have posted a relatively bigger outflow than the US funds. But the alpha generated by this simple strategy is minimal.
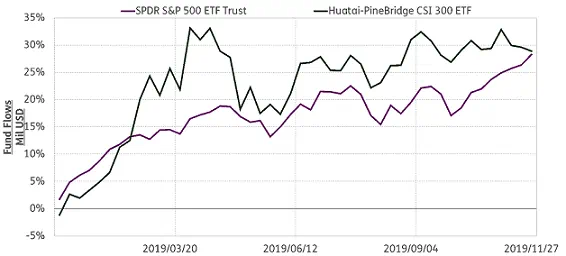
Chart 2 – Cumulative Weekly Benchmark Performance
There are, however, several more granular ways to analyze the raw flow data. One of these is the application of a variable called ION$ (Inflow, Outflow, Net flow in US$), which is defined as:
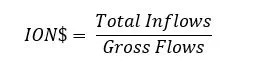
Where inflows is the sum of all funds that received inflows and gross flows is the sum of all flows, positive or negative, into all funds.
For our purposes, ION$ measures the real driving force of a given flow, telling us if the headline number reflects a broad consensus that steers money into multiple funds or depends on outsized flows to a small number of funds.
Under a neutral situation, the variable is supposed to be 50%, as half of the flow should be inflow and the other half of the flow should be outflow. For example, if the variable is above 50%, the inflows are taking the wheel.
As Chart 3 and Chart 4 illustrate, China-dedicated mutual funds have seen inflows in 2019, but not enough to offset the dominant outflow trend for China ETFs. As for the US, YTD outflows have largely been driven by actively managed funds.
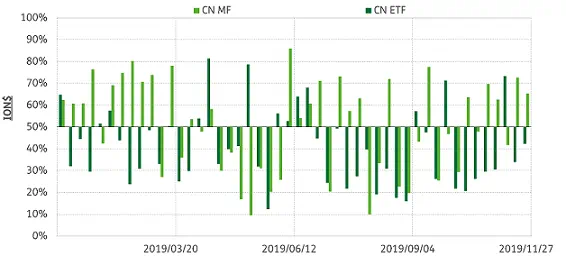
Chart 3 – ION$ of China Funds
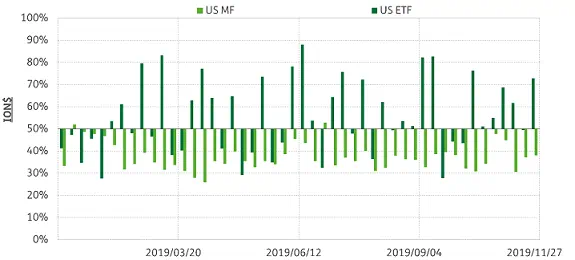
Chart 4 – ION$ of US Funds
Where does this lead us in terms of generating a signal? The ION$ data, with ETFs driving outflows for China Funds and actively managed funds for US Funds, suggests that there may be a contrarian relationship between long term flows to US and China Equity Funds.
To test this theory, we form a simple rule-based trading strategy based on below algorithms.
![]()
![]()
In short, when US funds have larger long-term flow than China funds, the strategy signal will shift to China equity market. At the same time, if China funds have a higher long-term flow than US funds, the strategy signals will shift to US equity market.
Chart 5 illustrates the cumulative performance of the strategy, which has consistently outperformed an Equal Weight Portfolio since 2007.
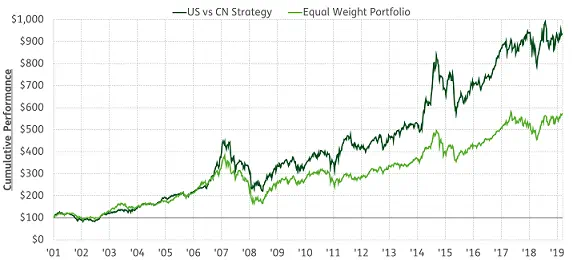
While the signal generated by this approach overwhelmingly favored the US in 2018 and through the first half of this year, the signal has tilted decisively towards China since early August.
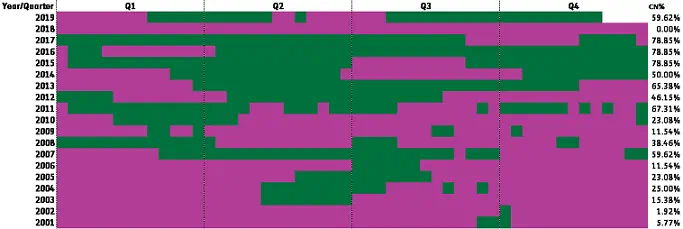
Chart 6 – Historical Strategy Signal
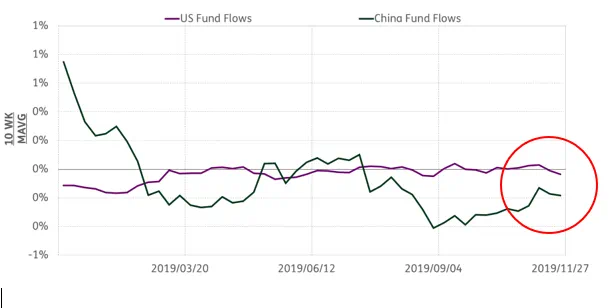
Chart 7 – Most Recent Trend
However, with the gap between flows to US and China funds has closed in recent weeks (see chart below), suggesting the signal may shift from China back to US in 1Q20.
Did you find this useful? Get our EPFR Insights delivered to your inbox.