Steve Muzzlewhite
Steve Muzzlewhite, Global Head of Customer Solutions at EPFR, helps all our clients better understand the value of EPFR data and its role in detecting trends, driving revenue, and identifying new strategies. He analyzes mutual fund and exchange-traded fund flows to uncover use cases for different clients, whether equity sales and trading teams needing daily flows, global macroeconomists at investment banks needing monthly, aggregate numbers or Buy-side Portfolio Managers looking to use our data to drive investment signals.
Steve previously served on the equity derivatives trading desk at Commerzbank AG, creating a buyside business within a sell-side bank, allowing him to offer unique buyside insights to sell-side clients. But he also wields extensive experience at asset management firms, including BlackRock, Mercury Asset Management and State Street Global Advisors, working with a diverse range of products across traditional, alternative, active and passive strategies.
Additionally, he worked at Barclays Funds, beginning at the firm at 16 in an administrative role and ascending to manager of a team of unit trust dealers by 21 with the Funds Dealing Desk. He opted to continue on his career path instead of pursuing a degree, later earning his Chartered Alternative Investment Analyst (CAIA) designation.
Steve is an avid football fan who devotes his time outside the office to his wife and teenaged children.
“We live in an empirical data-driven world. It’s never about gut feelings anymore. At EPFR, I can watch the slightest shifts in fund flows and begin to predict major market moves. I often ask firms that don’t subscribe to our data: ‘How do you track both Investor and Professional Portfolio Manager sentiment, which is exactly the data we capture on a global scale?"

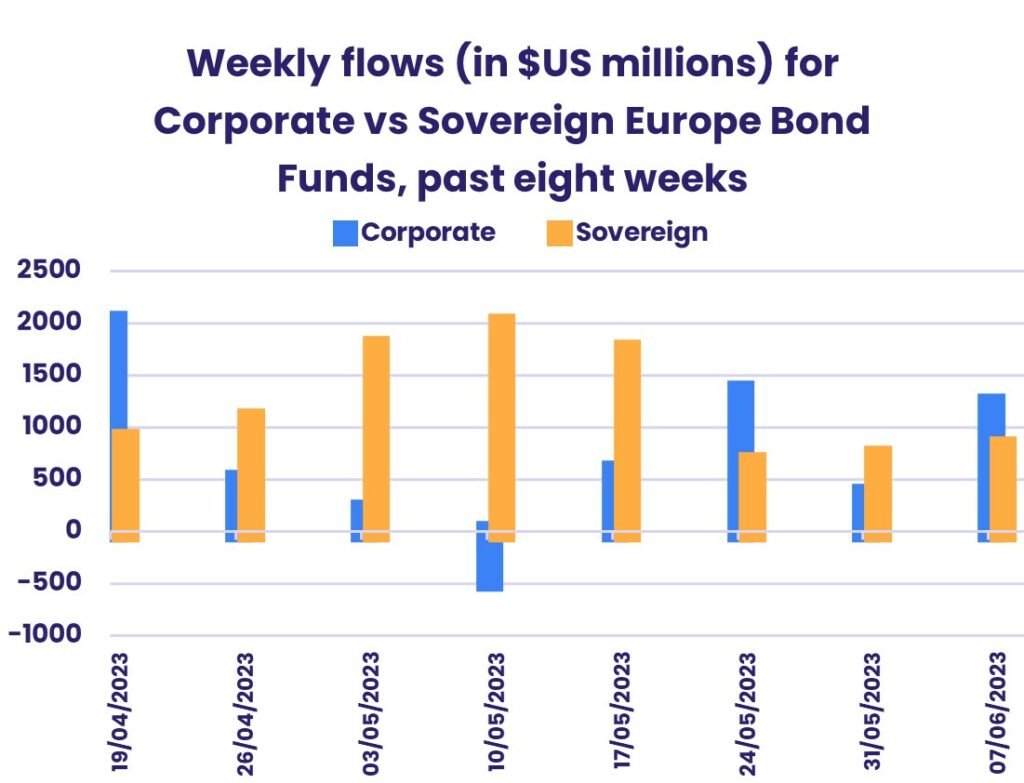
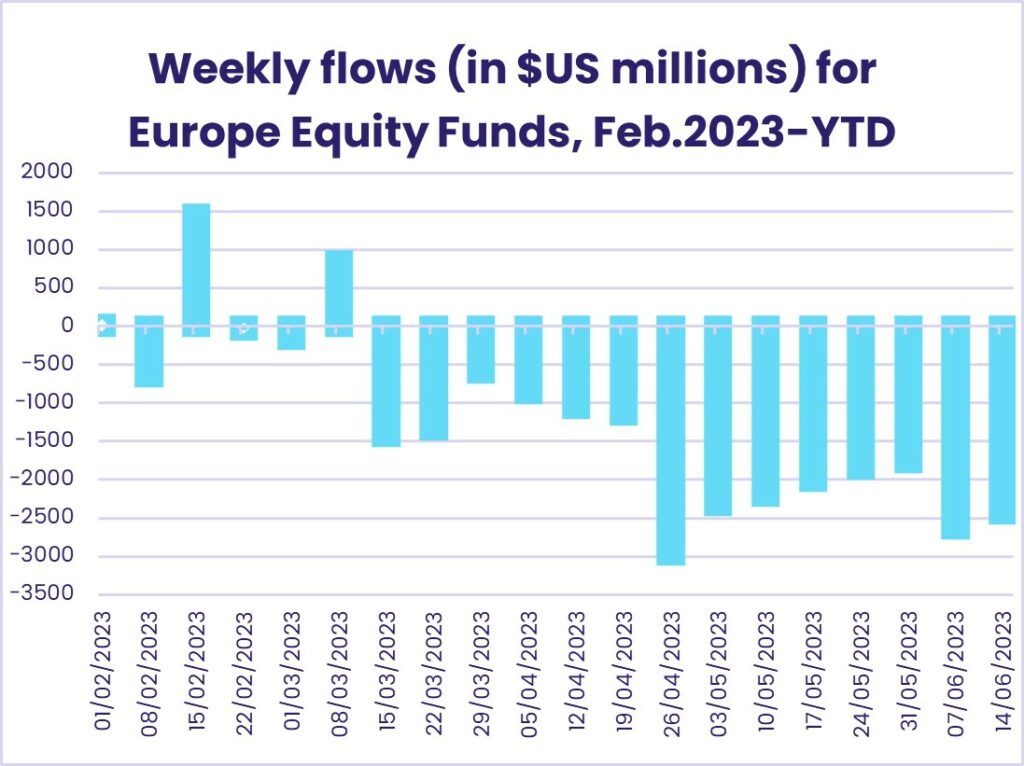
Weekly fund flows highlights – 12th June 2023
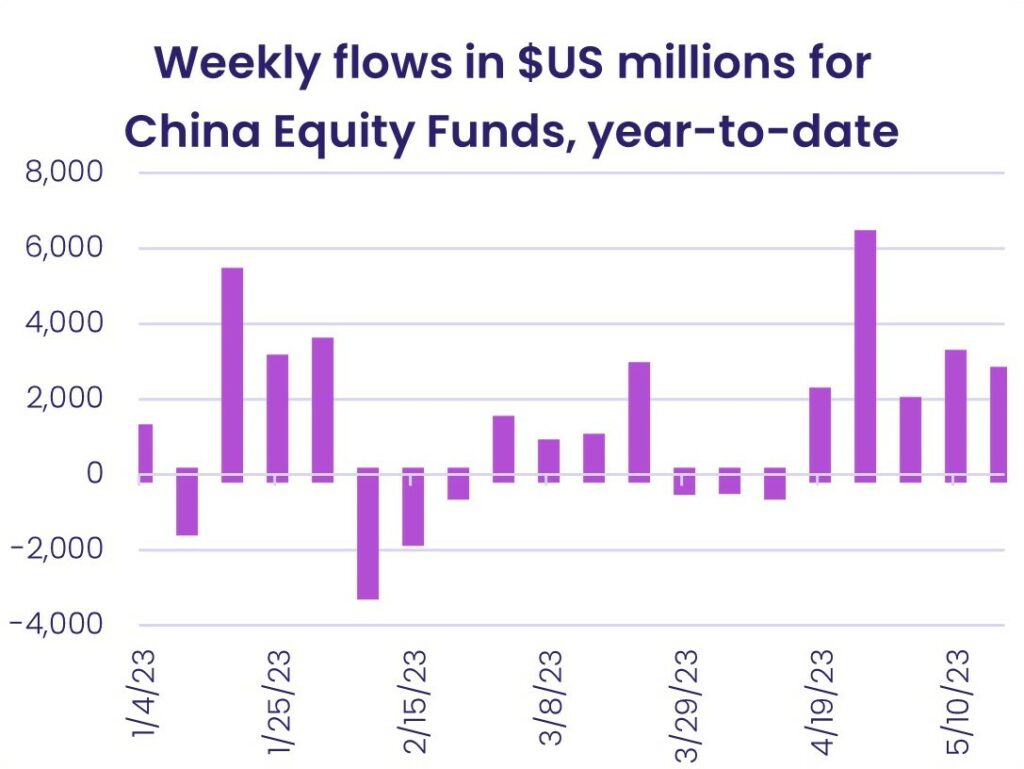
Weekly fund flows highlights – 22nd May 2023
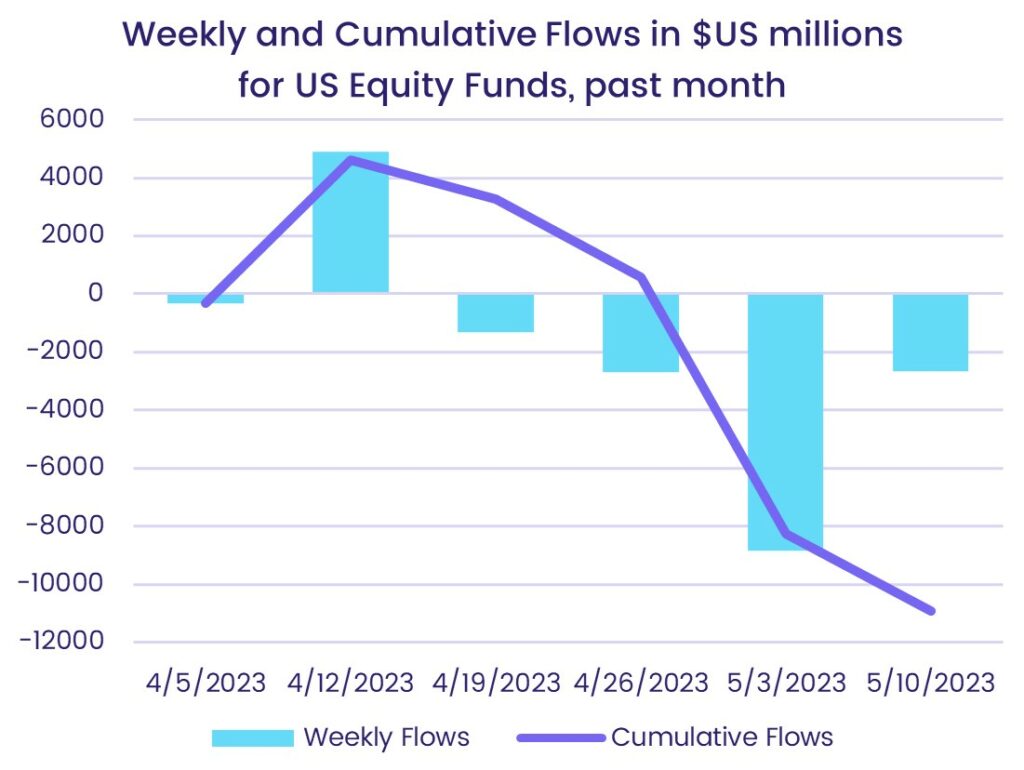
Weekly fund flows highlights – 15th May 2023
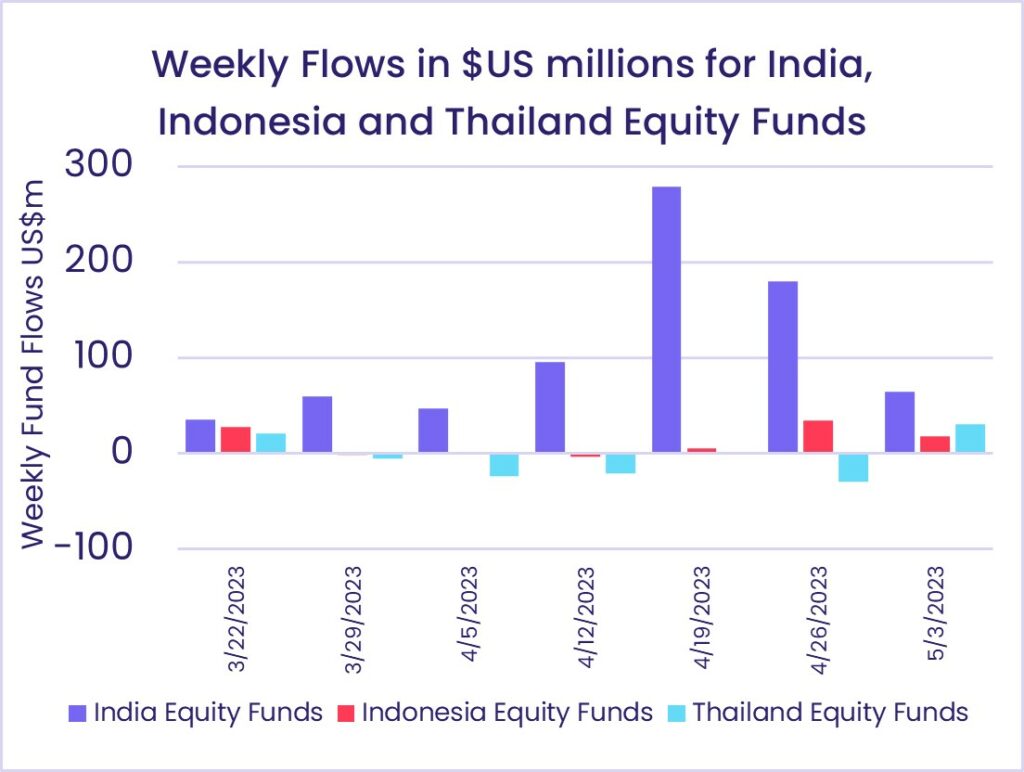
Weekly fund flows highlights – 8th May 2023
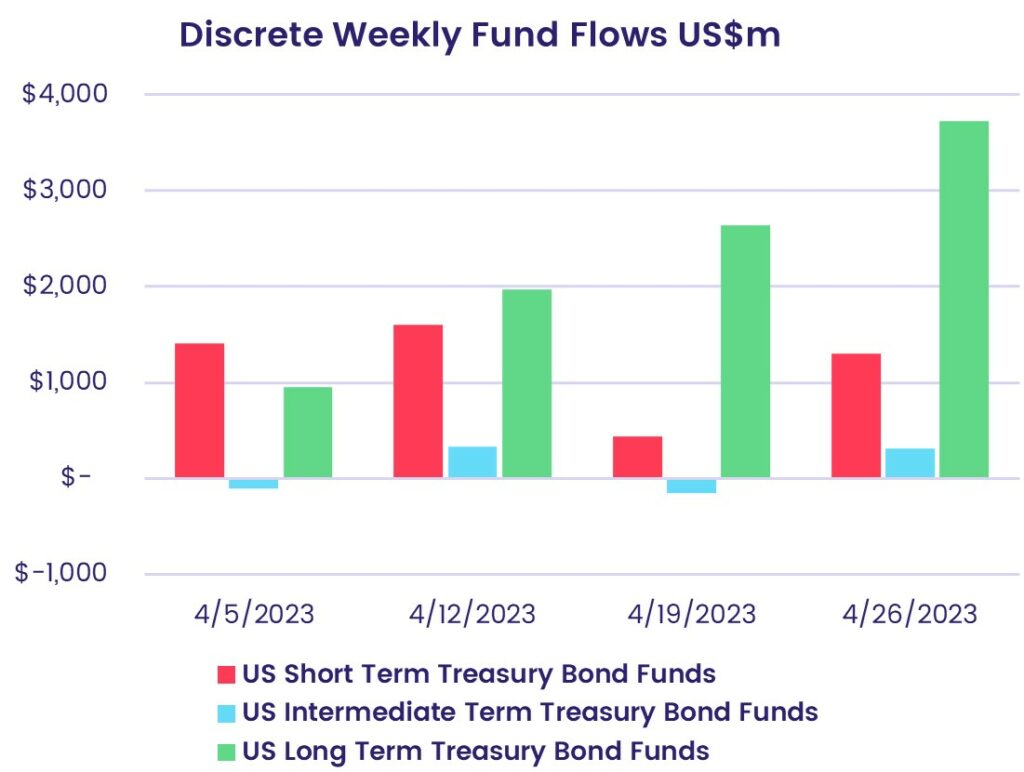
Weekly fund flows highlights – 1st May 2023
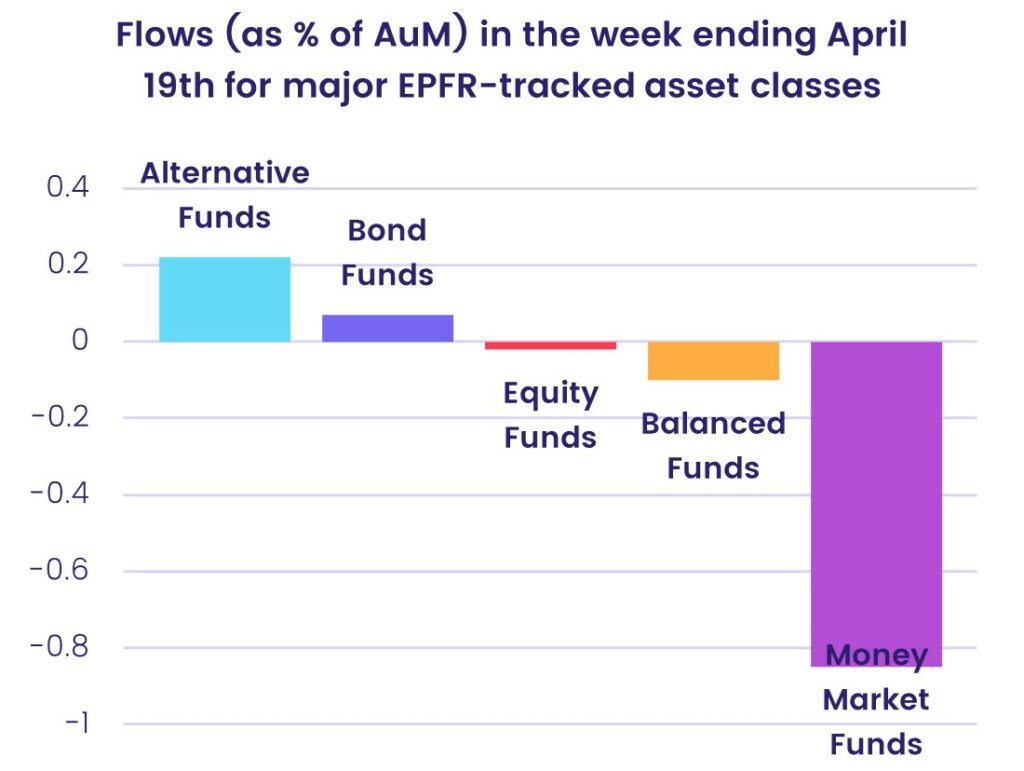
Weekly fund flows highlights – 24th April 2023
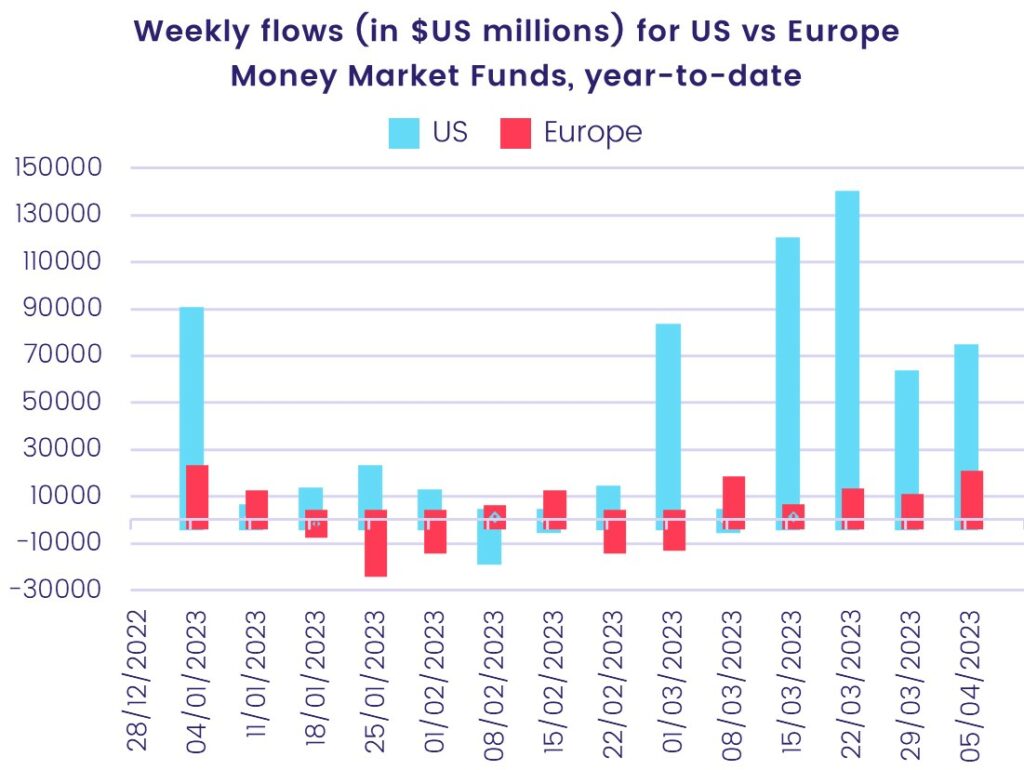
Weekly fund flows highlights – 10th April 2023
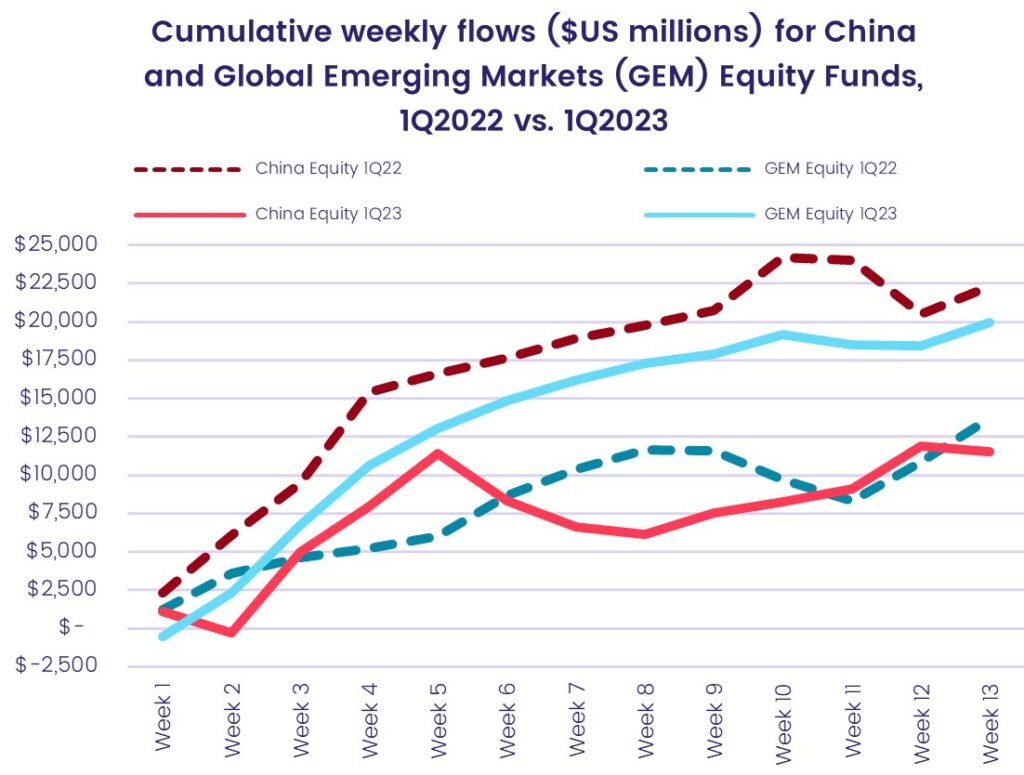
Weekly fund flows highlights – 3rd April 2023

Weekly fund flows highlights – 27 March 2023
Weekly fund flows highlights – 20 March 2023
