Using EPFR and CEIC data to analyze the August 2024 correction

Fund flows, monetary policies and key macroeconomic indicators interact in intricate ways.

The dramatic selloff recently experienced across global markets was thought to have been triggered by the Bank of Japan’s latest decision, leaning towards a monetary normalization policy. Weaker-than-expected indicators coming from the US have also affected market sentiment.

What were money flows showing before the selloff?

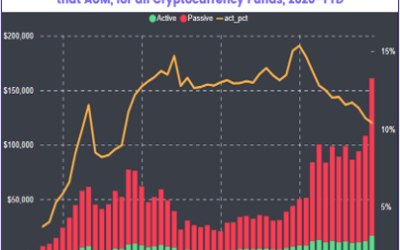
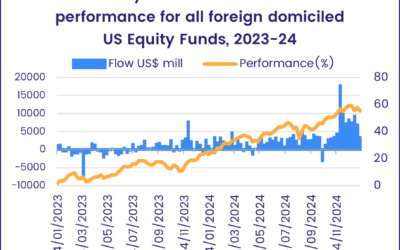
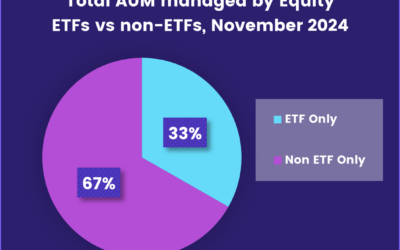
Using EPFR’s fund flow data and CEIC’s proprietary, machine learning-driven economic nowcasts, this Chart Pack dissects the market positioning in the run up to sell-off.

Charts representing "US and Japan Year to date Equity Fund Flows"

To request your complimentary copy, please fill out the form below.

Related Posts

Rotating to safety in early September

Rotating to safety in early September

Ahead of a nine-day window encompassing policy meeting by the European Central Bank, US Federal Reserve and Bank of Japan, investors steered another $16.6 billion into EPFR-tracked Bond Funds and $30 billion into Money Market Funds while Equity Funds posted their first collective outflow since mid-April.

All goldilocks and no bears in late August

All goldilocks and no bears in late August

The Paris Summer Olympics ended with the US and China occupying first and second position in the medal standings. They occupied the same positions when the latest week’s fund flows were tallied, with EPFR-tracked China Equity Funds pulling in over $6 billion for the fifth time so far this year and combined flows into US Equity, Bond and Money Market Funds exceeding $40 billion for the third week running.

Better, More Actionable Insights

Let us show you how EPFR can create value for your specific strategy