Treasury yields slip, ETF assets march higher

Going into the final week of the first quarter, global markets were treading water amidst a welter of sometimes contradictory events and signals. A reporting period that started with the first quadruple witching of the year and ended with the Suez Canal blocked by a massive container ship also featured renewed lockdowns in Europe, yields on the US 10-year dropping back to the 1.6% level and North Korea testing nuclear capable missiles.

Flows to EPFR-tracked funds reflected the general uncertainty, with net flows to Equity Funds less than a 15th of the previous week’s total while Bond Funds took in the equivalent of 0.14% of AUM and Money Market Funds recorded their biggest weekly inflow year-to-date.

The week also saw the release of data showing that the assets managed by EPFR-tracked EquityBondAlternative and Balanced Exchange Traded Funds (ETFs) climbed past the $8 trillion mark in February. They passed the $7 trillion mark in August of last year, $6 trillion in November 2019, $5 trillion in January 2018, $4 trillion in May 2017, $3 trillion in March 2016, $2 trillion in July 2013 and $1 trillion in December 2009.
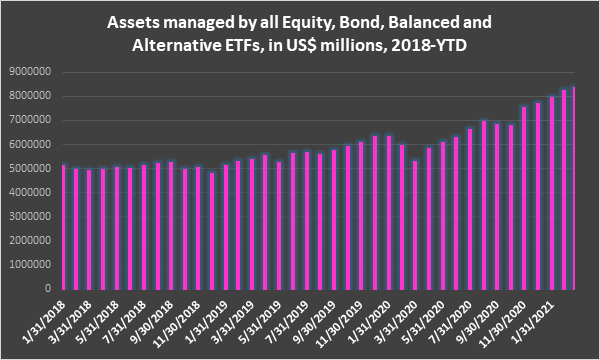
Graph depicting the 'Assets managed by all equity, bond, balanced and alternative ETFs, in US million dollars, from 2018 to date'.

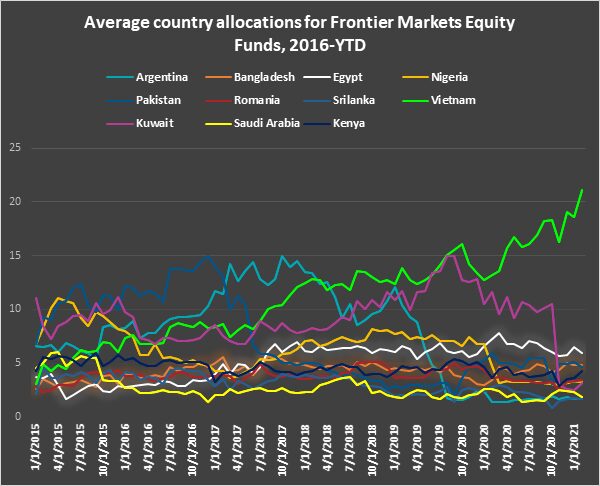
Graph depicting the 'Average country allocations for frontier markets equity funds, from 2016 to date'.

Did you find this useful? Get our EPFR Insights delivered to your inbox.

Related Posts

Clock ticking down to second Trump presidency

Clock ticking down to second Trump presidency

The second week of January saw Americans mourning their 39th president, watching in horror as large swathes of Los Angeles burned and – along with the rest of the world – positioning themselves for the return of Donald Trump to the White House. Against this backdrop, which also included better-than-expected inflation figures from the US and UK, investors steered another $20 billion into US Equity and Bond Funds, rotated from cryptocurrencies to gold, responded strongly to the first round of financial sector earnings reports and pulled over $1.8 billion from Equity Funds with socially responsible (SRI) or environmental, social and governance (ESG) mandates.

Investors come out of the gate like bulls

Investors come out of the gate like bulls

A damn-the-torpedoes spirit gripped investors during the first week of the New Year.

Faced with bond vigilantes stampeding UK sovereign yields and year-ahead forecasts devoting space to overheated US valuations, the impact of tariffs on inflation and trade, China’s slowing economic growth, rising corporate defaults and the vast borrowing requirements of most leading economies, investors responded in contrarian fashion. They steered over $10 billion into both US Equity and Bond Funds while flows into China Equity and High Yield Bond Funds climbed to four and seven-week highs, respectively.

Outside of the US, sails flapping at year’s end

Outside of the US, sails flapping at year’s end

The first two months of 2024 saw Japan, India, Technology and China Equity Funds absorb a net $5.2 billion, $10.7 billion, $14.1 billion and $44.6 billion, respectively, while US Equity Funds pulled in a minimal $3.4 billion. During the final two months of last year, however, US Equity Funds added $174 billion as they set a new full-year inflow record while flows to the other groups ranged from an outflow of over $10 billion for Japan Equity Funds to an inflow of $2.2 billion for China Equity Funds.

Better, More Actionable Insights

Let us show you how EPFR can create value for your specific strategy