Investors are welcoming the strong earnings results coming from different companies so far. A healthy labour market and retail sales data from US is also giving extra encouragement to money managers. As a result, for the first time since September, US Equity Funds has seen consecutive weekly inflows.
The market melt-up narrative started to gain recognition among investors – that is evident. But another question on everyone’s mind has nothing to do with strength of earnings, sustainable macroeconomic data or dovish central banks. It is that time of the year. Will the statistical prophecy ‘Sell in May, go away’ will hold true this year? Are we going to see a melt-down instead of a melt-up in May? These questions are hard ones to answer with accuracy. But with the help of EPFR data, we can explore if this phrase is an actual truth in terms of global fund flows.
The well-known phrase is originally linked to an old-English saying: “Sell in May and go away and come on back on St. Leger’s Day”. St Leger Day, which falls on mid-September, is the oldest horseracing classic in England. Back 17th century, traders would generally go out in May to enjoy summer holidays and come back around mid-September to watch this race. So, the actual phrase points out not only May, but the period between May and October.
In Figure 1, using EPFR’s fund flows database, we calculate the total flows to global equities and bonds, as a percentage of the total AuM and plot the distributions as boxplots in two distinct periods. We use monthly fund flow data and the time period of these calculations is between January 2000 and April 2019. The mid-point of the historical flows are the lines that divide the box into two parts. Upper and lower edges of the boxes show 75th and 25th percentiles of flows(%).
The old saying seems to be true according to this chart. Fund flows to equities between May and October has been lower compared to November-April period globally. In fact, the median fund flow around May-October is around zero and there are more negative outflows in this period compared to April-November period.
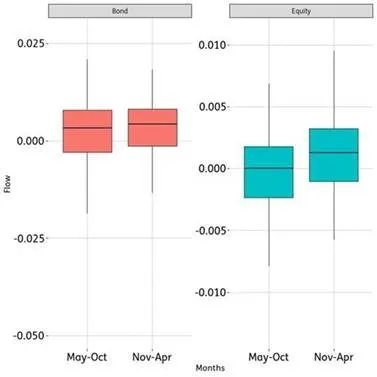
Figure 1 : Distributions of Fund Flows to Bonds & Equities (%) in May-Oct and Nov-Apr periods (2000-2019)
If we narrow down our investigation to a more recent period between 2013 and 2019 the observation seems to hold. Figure 2 shows that, although there have been outliers of inflows to equities in this period, on average May-October period has seen lower inflows.
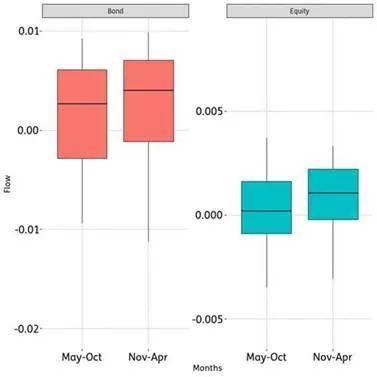
Figure 2 : Distributions of Fund Flows to Bonds & Equities (%) in May-Oct and Nov-Apr periods (2013-2019)
More interestingly, this phenomenon seems to hold for equities in different regions. We plot Figure 3, analysing flows for six different equity regions (Asia Ex-Japan, Japan, UK, US, Europe Ex-UK, Emerging Markets) and five different fixed income asset classes (EM Hard Currency, EM Local Currency, US High Yield, US Investment Grade and US Treasuries). For all equity regions, median flows(%) are lower in May-October period. In general, there are also higher negative outflows. In fixed income, we see a similar behaviour in US High Yield asset class.
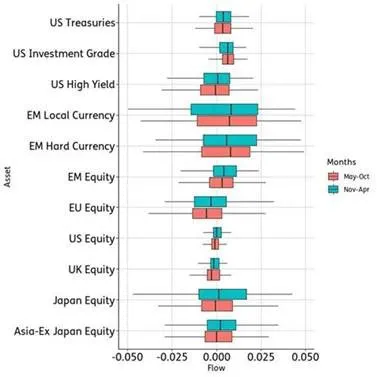
Figure 3 : Distributions of Fund Flows to Different Regions and Asset Classes (%) in May-Oct and Nov-Apr periods (2000-2019)
Historical fund flow data shows that “Sell in May go away” phrase is more than a simple prophecy. There might be structural reasons we see this phenomenon throughout long periods. Exploring this phenomenon with the help of fund flow data might explain price pressures occurring on some assets/geographies especially throughout summer months.
Did you find this useful? Get our EPFR Insights delivered to your inbox.

