Collateralized loan (CLO) or debt (CDO) obligations allow financial institutions to repackage various financial instruments into securities that can be sold in tranches to investors with different risk appetites. In the case of the latter, they were used during the first decade of this century to repackage increasingly risky mortgages that were major contributors to the 2007-09 financial crisis.
CLOs, which first appeared in the 1980s, also experienced heavy losses during the crisis. But, overall, they fared better because they are backed by corporate loans rather than mortgages. Their rebound from that period has gathered steam, with annual issuance since 2015 running at or above $100 billion annually, and demand from yield-hungry investors remains strong.
Modern CLOs and CDOs are regarded as much safer than their pre-crisis versions. But where, in the spectrum of major fixed income asset classes do they sit?
A fund of tranches
Collateralized Loan Obligations (CLOs) are constructed from pools of corporate loans – frequently leveraged loans – that result in a customized security. That security is then marketed and sold by tranches that offer varying risk and return characteristics. These tranches range, in descending order of risk, from senior through mezzanine to junior. CLOs use the same methodology but draw from a wider range of loan types.
Bond funds are among the buyers of these securities and a universe of CLO-dedicated funds has emerged over the past decade.
EPFR’s Bond Fund universe is already highly granular, with views into corporate vs sovereign debt, high yield or investment grade and established asset classes such as municipal and inflation protected debt. Taking this one step further, fund-level details captured in the data we offer allow us to custom group niche or thematic groupings based on a keyword mentioned in the fund or benchmark name.
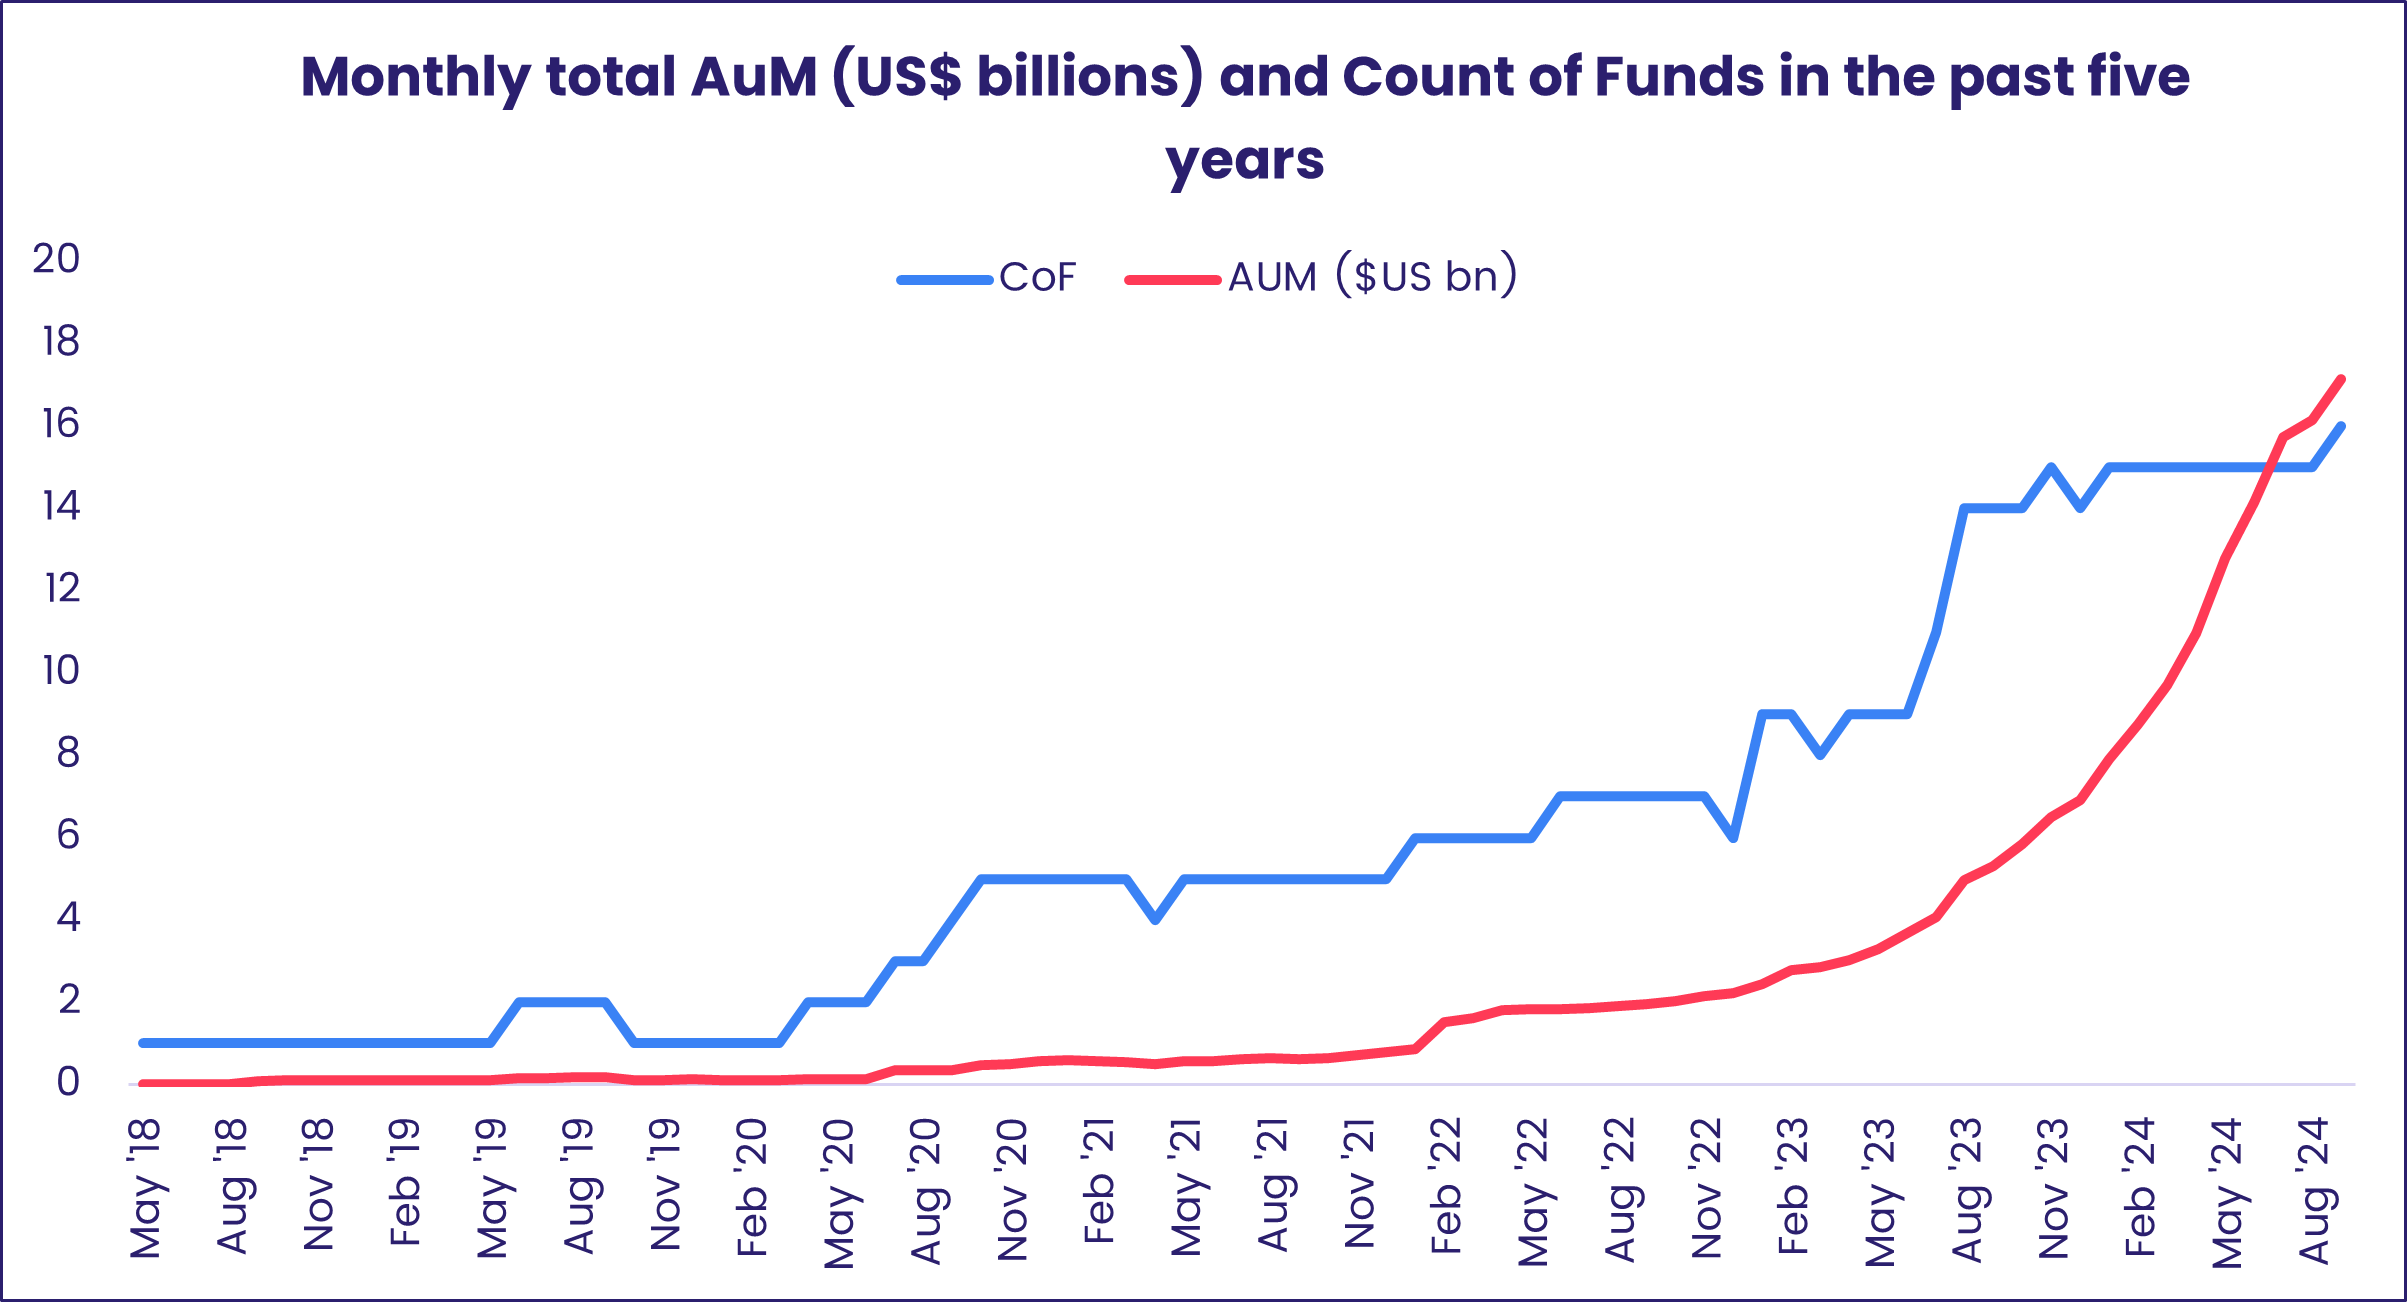
Isolating funds with “collateralized loan” or “CLO” in their mandates and benchmarks shows the growing investor appetite for these securities. Asset managed by EPFR-tracked Collateralized Loan Obligations Funds took off at the start of 2022 and have increased 20-fold since then. This year alone, the AuM for CLO Bond Funds has grown by nearly 250%, surpassing the $17 billion mark as of September 2024. The number of funds within this group – which now stands at 16 – picked up momentum in mid-2020 then again during 2023.
Among the major characteristics of CLO Bond Funds are:
- All are actively managed.
- The majority are broadly categorized as Bank Loan Funds, and 13 of the 16 funds also have Investment grade mandates.
- There are 10 US-dedicated ETFs within the group, accounting for 92% of the AuM, and the remaining are Europe Regional or Global dedicated non-ETFs.
- Funds benchmarked to the JPMorgan CLO indices account for over 90% of the headline number.
Comparing the more niche grouping of CLO Bond funds to the broader Investment Grade Bank Loan Fund group reveals that flows into CLO Bond Funds have outpaced that of the larger group since 2020 by a 3-to-1 margin.
What are investors buying into?
CLO Bond Fund flows have been positive for 36 consecutive months. This year, monthly flows into these funds have been running at unusually high levels, ranging from $770 million in January to a record-setting $1.78 billion in May 2024. Prior to this year, the biggest monthly inflow ever received was $646 million in Feb 2022.
All of which raises an important question: Do the returns justify the enthusiasm – and risk appetite – being shown by investors?
To answer this question, we employ principal components analysis, looking at returns of these funds after September 2020 and comparing them with other fixed income fund groups. In the process, each group is characterized by 60 data points that represent every month’s return between October 2020 and September of this year. From this, we can establish 60 linear combinations or risk factors that encompass geography, volatility of returns, investment styles and other key metrics.
The factor with the greatest bearing becomes the first principal component, with the next strongest becoming the second. The remaining, weaker factors are then discarded. The two factors that make the cut are used as the axes that allow us to represent our data in two dimensions by way of a simple dot-plot chart. The result is a visual representation (see chart below) showing the return profiles for each sector.
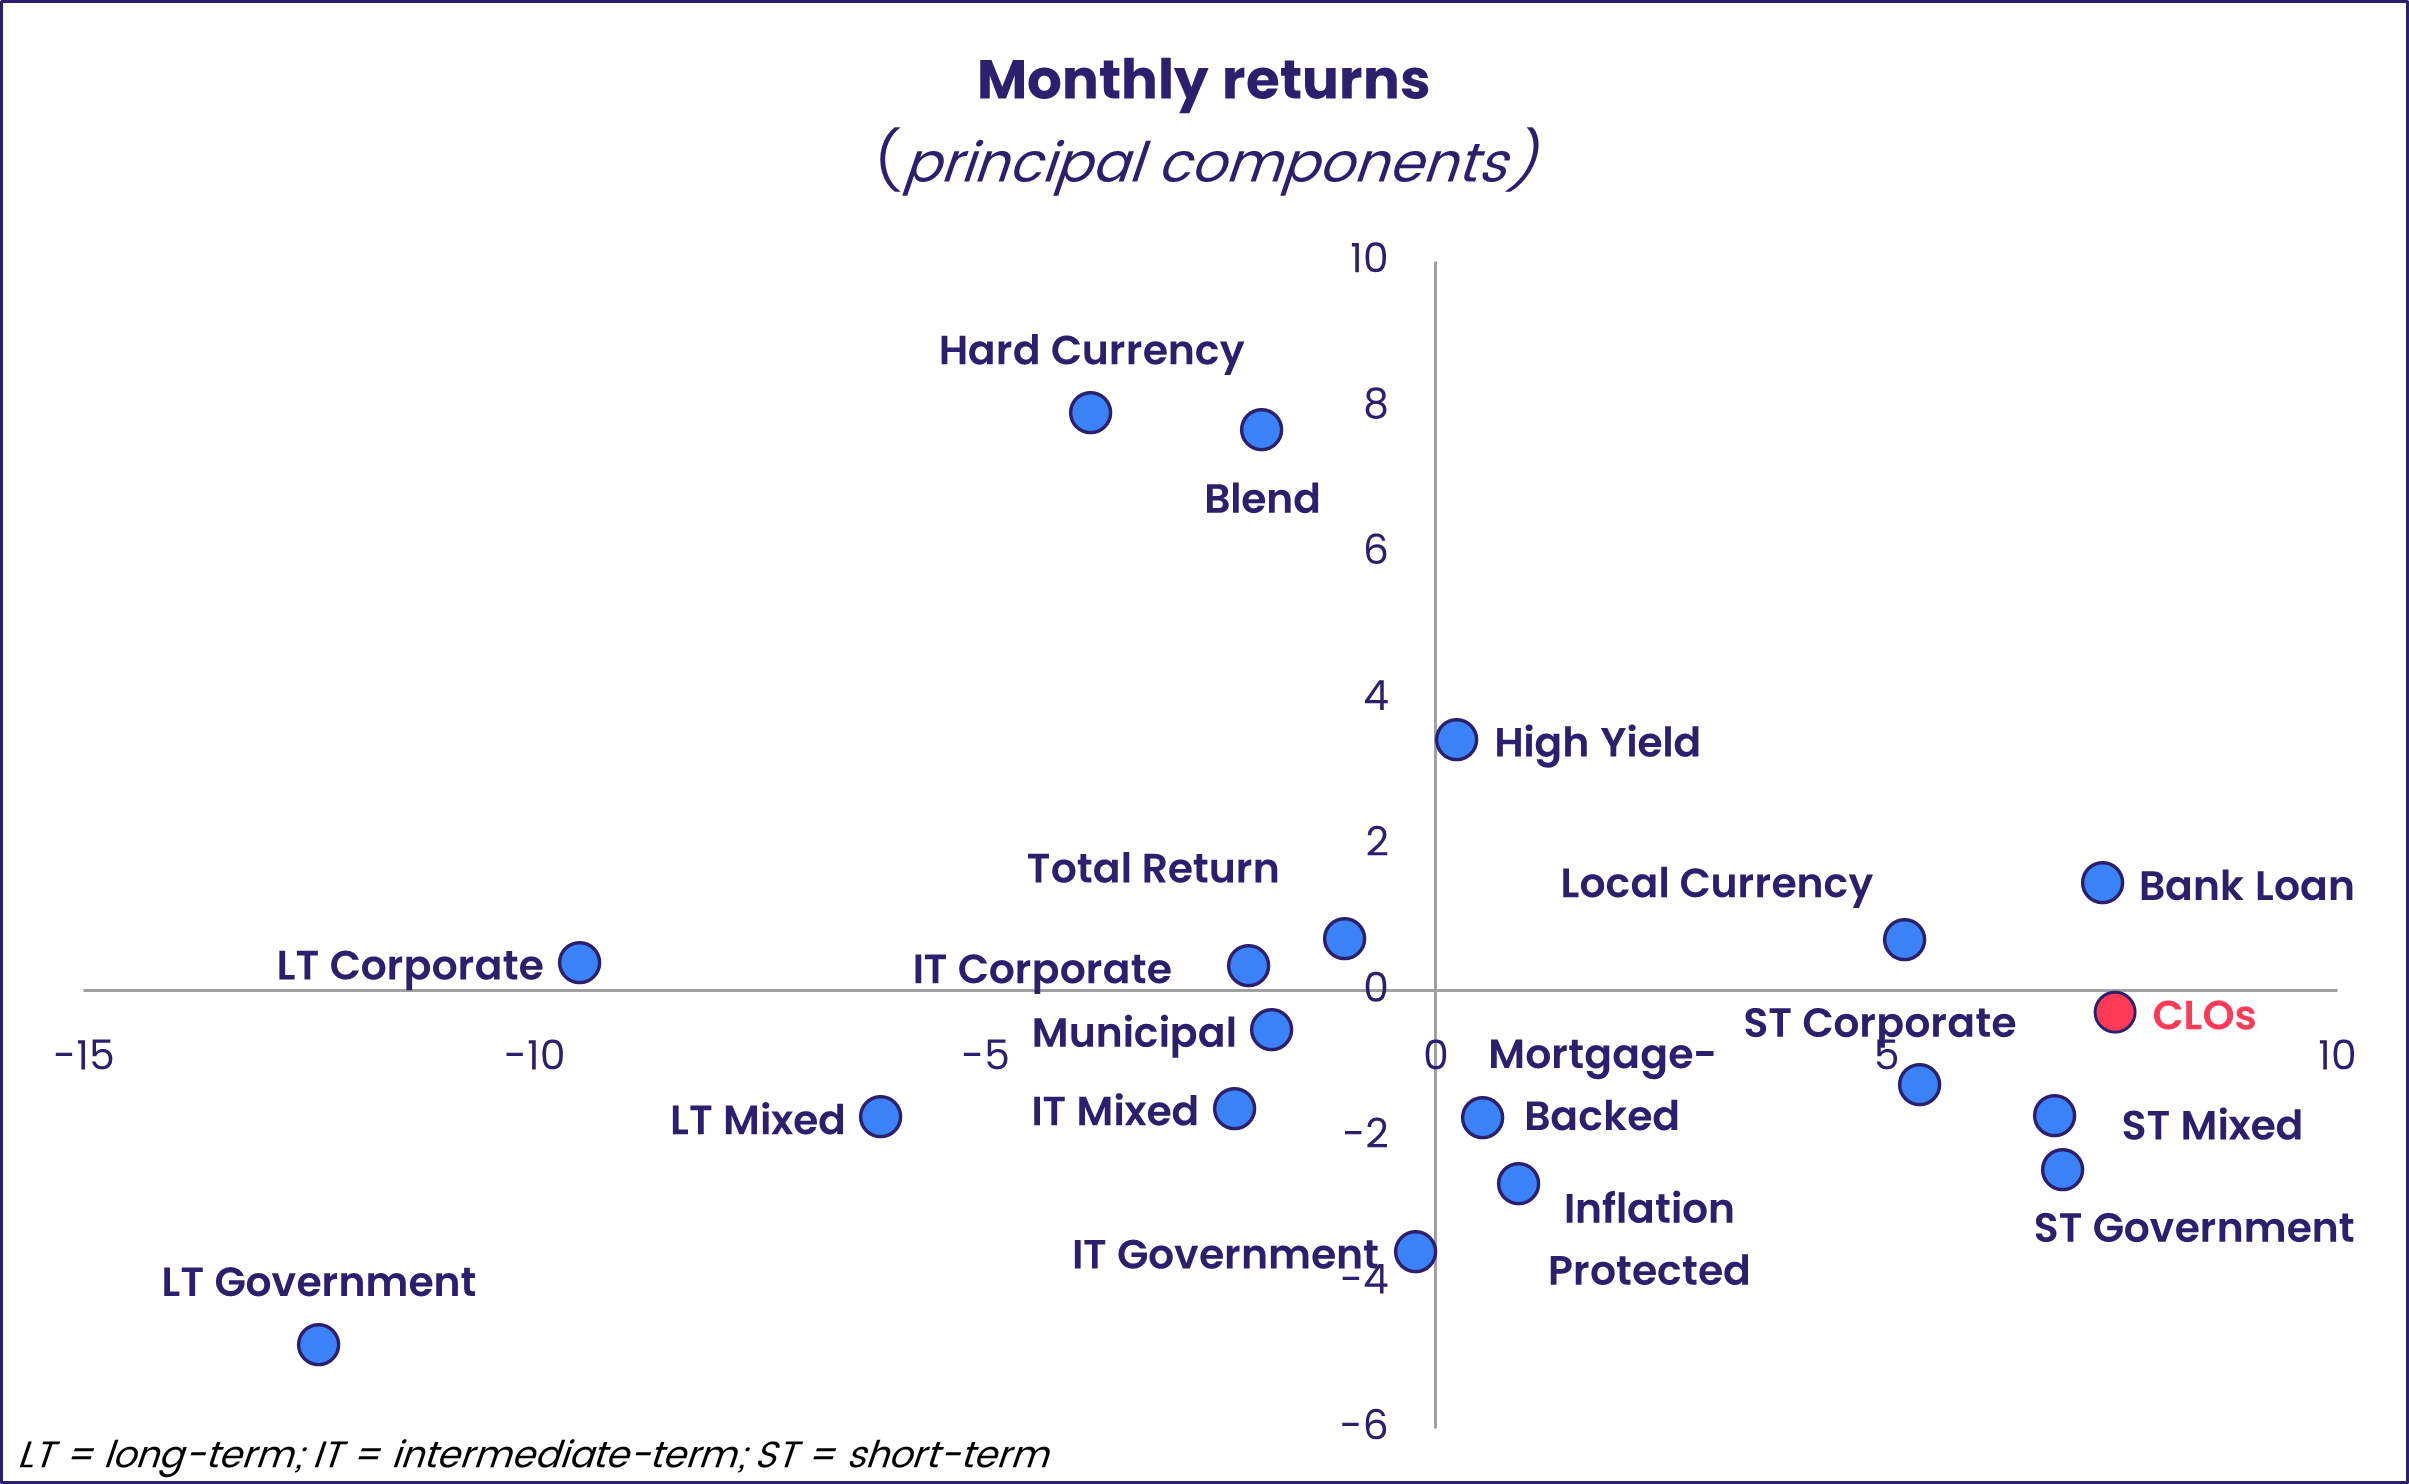
From the exhibit, we can see that CLO Funds (the red dot) perform like the Bank Loan Funds tagged in EPFR’s database. The group’s return profile is also similar to those of Short-term Government, Corporate and Mixed Bond Funds, as well as Local Currency Emerging Markets Bond Funds.
Getting to escape velocity
Our analysis shows that CLO fund returns have not yet broken free of the broader bank loan orbit, and hence deal with similar investment risks and opportunities.
Looking ahead, we will be closely watching to see how the Securities and Exchange Commission (SEC) responds to this soaring demand for CLO Funds. More funds will increase the size of the asset pool. Will that be enough to break free of Bank Loan Funds and occupy a new area in the risk-return continuum?
This will be the topic of a future Quants Corner.
Did you find this useful? Get our EPFR Insights delivered to your inbox.

