Last year, US companies spent over $1 trillion buying back their own shares. It was the third consecutive year in which repurchases topped the $1 trillion threshold, and fourth time in the last six years.
All this buying, which has exceeded the issuing of new equity by a margin that has sometimes exceeded 10-to-1, serves a number of stated purposes. The main one is returning value to existing shareholders, either by direct purchase of their shares or by shrinking the pool of available shares so that those still in the market – the so-called ‘free float’ – command a higher price on expectations that fewer shares will translate into higher earnings per share.

EPFR is in the position of having data that covers both cause (the buybacks) and potential effect (investor appetite for individual stocks) by way of its Corporate Actions and Stock Flows databases. This opens the door to analyzing the linkages between buybacks and the affected securities and, if they can be established, using those insights to create actionable strategies and models.
Follow the US leader
Although there are significant levels of share buybacks in other markets such as Japan, Hong Kong, the UK and continental Europe, EPFR limits its focus to the announced buybacks of companies listed on US exchanges. So, for the purposes of our analysis, we will only look at companies included in the Russell 1000 and 2000 indexes and the S&P 500 index.
Within these universes, the share of companies announcing a share buyback ranges from 1% for the Russell 2000 universe to nearly 2% for the larger capitalization Russell 1000 companies. This means that, in any given month, only one in 50 of the Russell 1000 companies will make a buyback announcement.
To get a statistically significant number of stocks to work with, we will look – on a rolling basis – at companies that have announced a share repurchase in the prior six months.

As you can see from the chart above, in any six-month window, on average, about 10% of large-cap and 5% of small-cap stocks make a buyback announcement.
Not surprisingly, the odds that a company will make a buyback announcement tend to follow the level of the S&P 500 with a lag.
Who’s returning what to whom…
We ran two-bucket back tests on the constituent names for each of the indexes (S&P 500, Russell 1000 and Russell 2000). The first bucket – Q1 –contains all stocks that announced a buyback in the last 6 months while the other – Q2 – has all the remaining stocks.
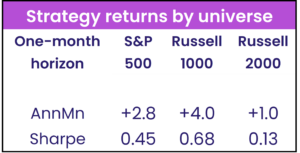
The table below shows annualized mean returns to the equal-weight basket of stocks that have announced buybacks in excess of that to stocks that haven’t (“AnnMn”) between 2Q11 and 4Q23. The row labelled “Sharpe” is simply the annualized mean scaled by the annualized standard deviation across time.

But how consistent is the performance? For the Russell 1000, we show equal-weight return to stocks that have/haven’t announced buybacks over the prior six months in excess of the equal-weight Russell 1000 returns.

As you can see from the chart above, results are relatively stable across time.
Our initial conclusion? There is value in harnessing EPFR’s Corporate Actions data to its Stock Flows dataset, using a simple in-or-out model. Bucketing a group of stocks whose issuers have announced buybacks on a rolling basis captures the upside while diluting the risk that comes with chasing individual buyback announcements, some of which the market will question rather than reward the company’s rationale for spending money on its own shares instead of, say, research and development.
…and what comes next?
Several ETFs in the last 15 years have adopted strategies that focus their investments in companies which repurchase their shares. One example is the Invesco Buyback Achievers ETF, which is up 24.2% in the past year and up close to 74% in the past five years. This ETF invests in companies which have reduced shares outstanding by at least 5% in the past 12 months.
Given both the quantitative and practical evidence, EPFR will be conducting more research on this topic.
Did you find this useful? Get our EPFR Insights delivered to your inbox.


