In a few short years, cryptocurrencies have gone from a fringe concept to a growing part of the financial narrative. Governments are adapting their regulatory frameworks in recognition of the new currencies’ growing footprint, and a raft of spot exchange traded funds (ETFs) have been launched since 1Q24.
Because of their novel structure, wildly fluctuating prices, growing numbers and wide range of value propositions, cryptocurrencies often appear to defy meaningful analysis. Does this ‘digital gold’ behave like a safe haven or speculative asset? Does the growing universe of Bitcoins, Ripples, Dogecoins, Solanas and TrumpCoins have any unifying principles other than fatigue with fiat currencies?
The rapid growth of Cryptocurrency Funds, most of which are tracked by EPFR, offer a new lens through which this young asset can be evaluated and compared against other asset classes. In this Quants Corner, we will isolate the return profiles for major cryptocurrencies and see if they provide a sufficiently strong foundation for deeper quantitative dives in the future.
Here, in growing numbers, today…
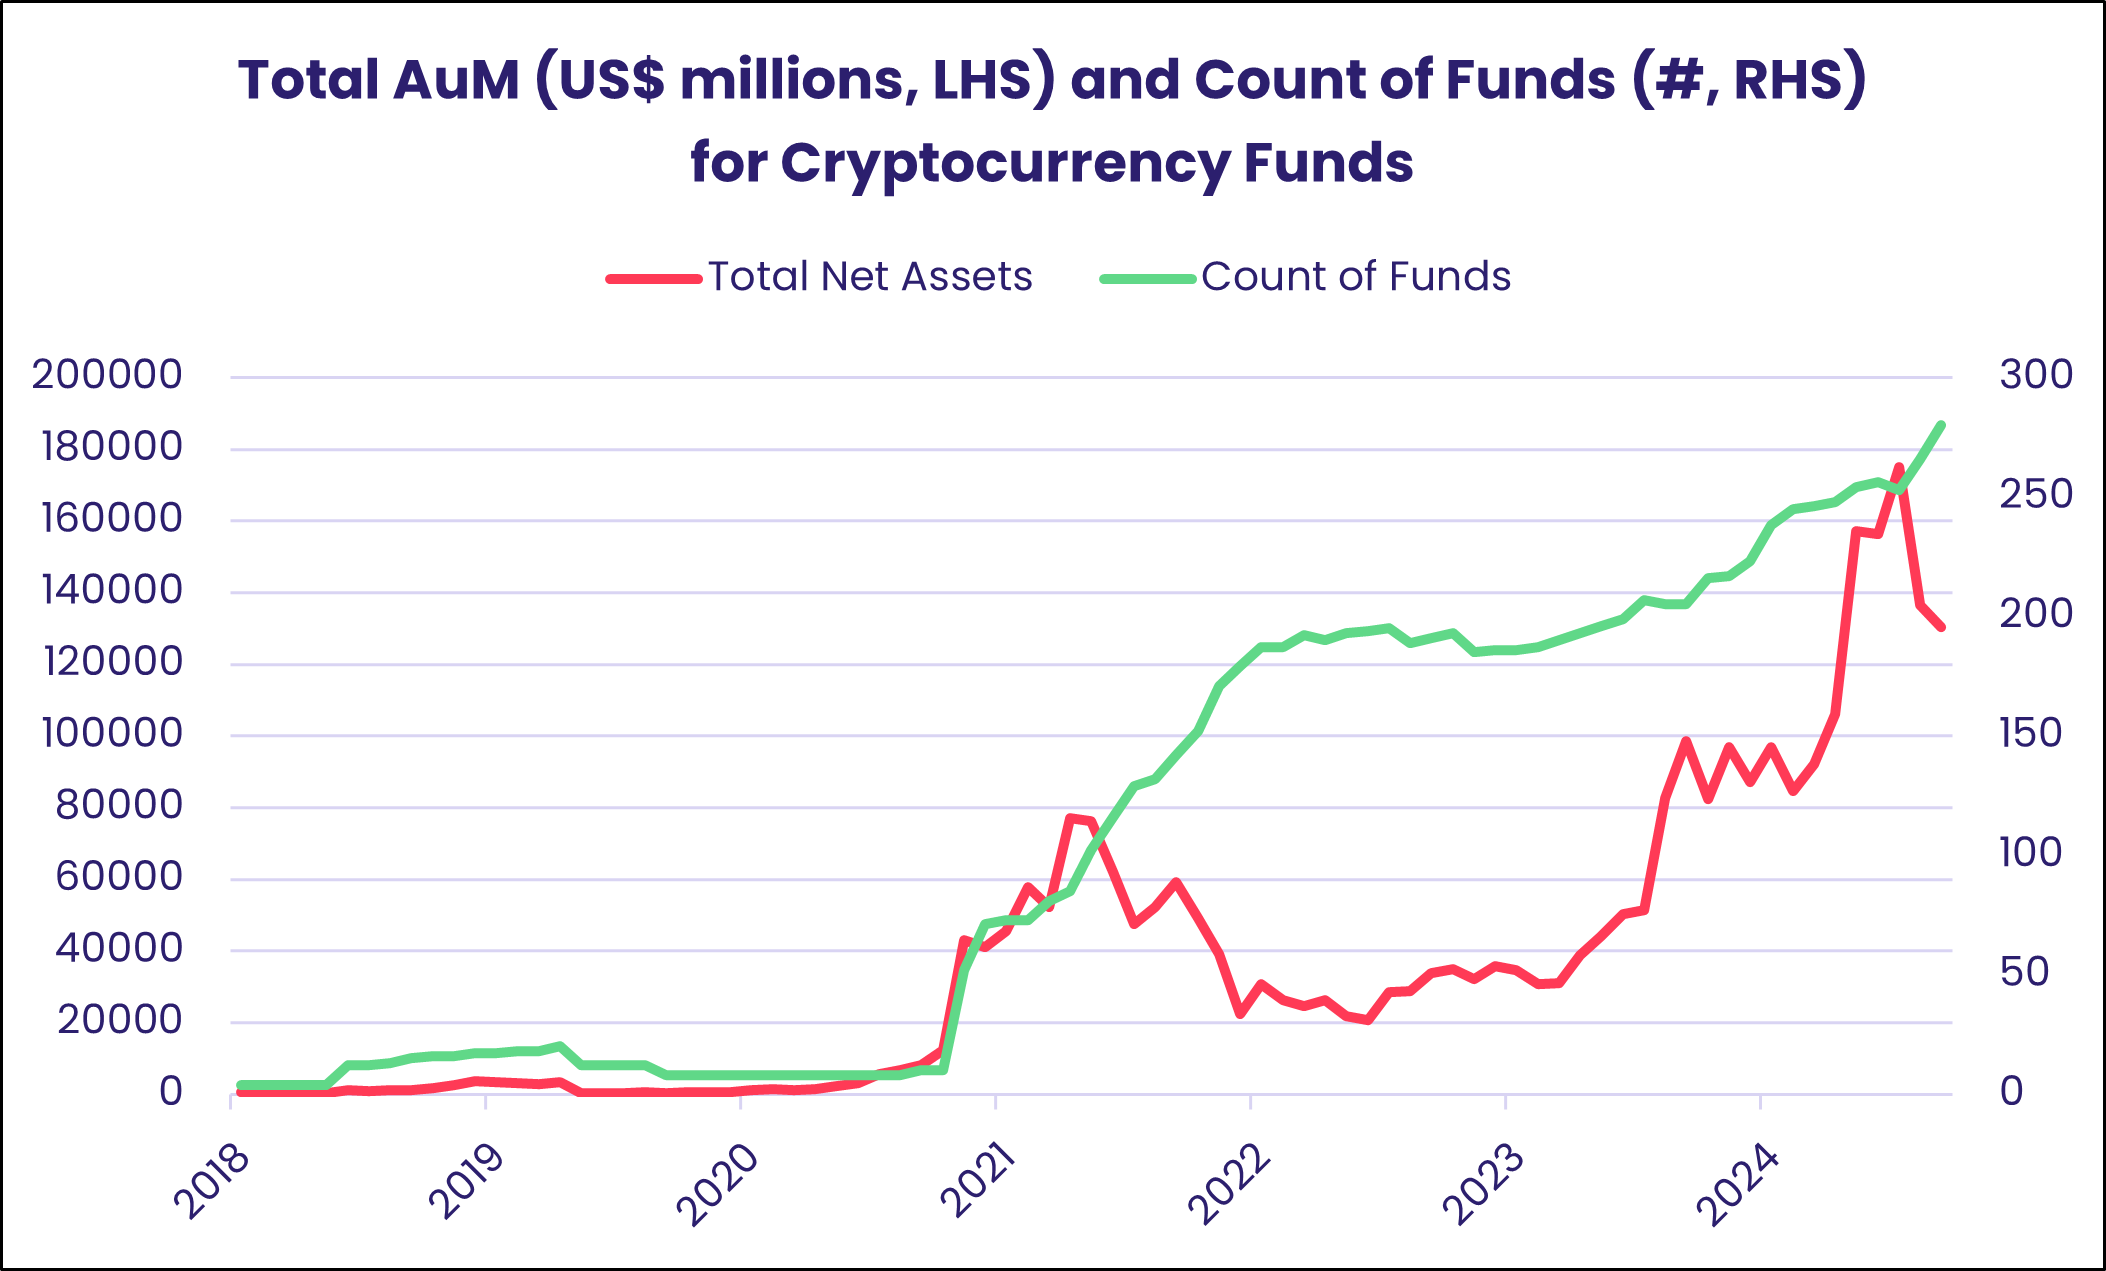
EPFR has been tracking dedicated Cryptocurrency Funds since mid-2018. It was not, however, until early last year that interest in these funds really took off. This was largely driven by the long-anticipated approval of spot Bitcoin ETFs by the SEC, which marked a turning point for the market. These ETFs allowed investors to gain direct exposure to Bitcoin without the complexities of managing digital wallets or navigating crypto exchanges, significantly lowering the barrier to entry.
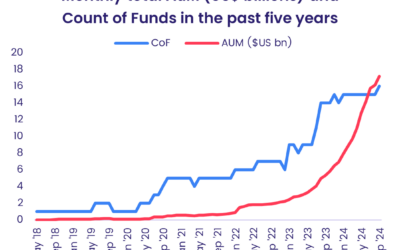
Within the universe of over 152,500 traditional and alternative fund shares classes domiciled globally and managing a collective $60 trillion that are tracked by EPFR, Cryptocurrency Funds currently sit in the Alternative Funds database. The AuM for this sub-group stood at just $12 billion four years ago, $20 billion in December of 2022, and $50 billion in Jan 2024 at which point it more than tripled in size to reach an all-time high of $175 billion in January of this year.
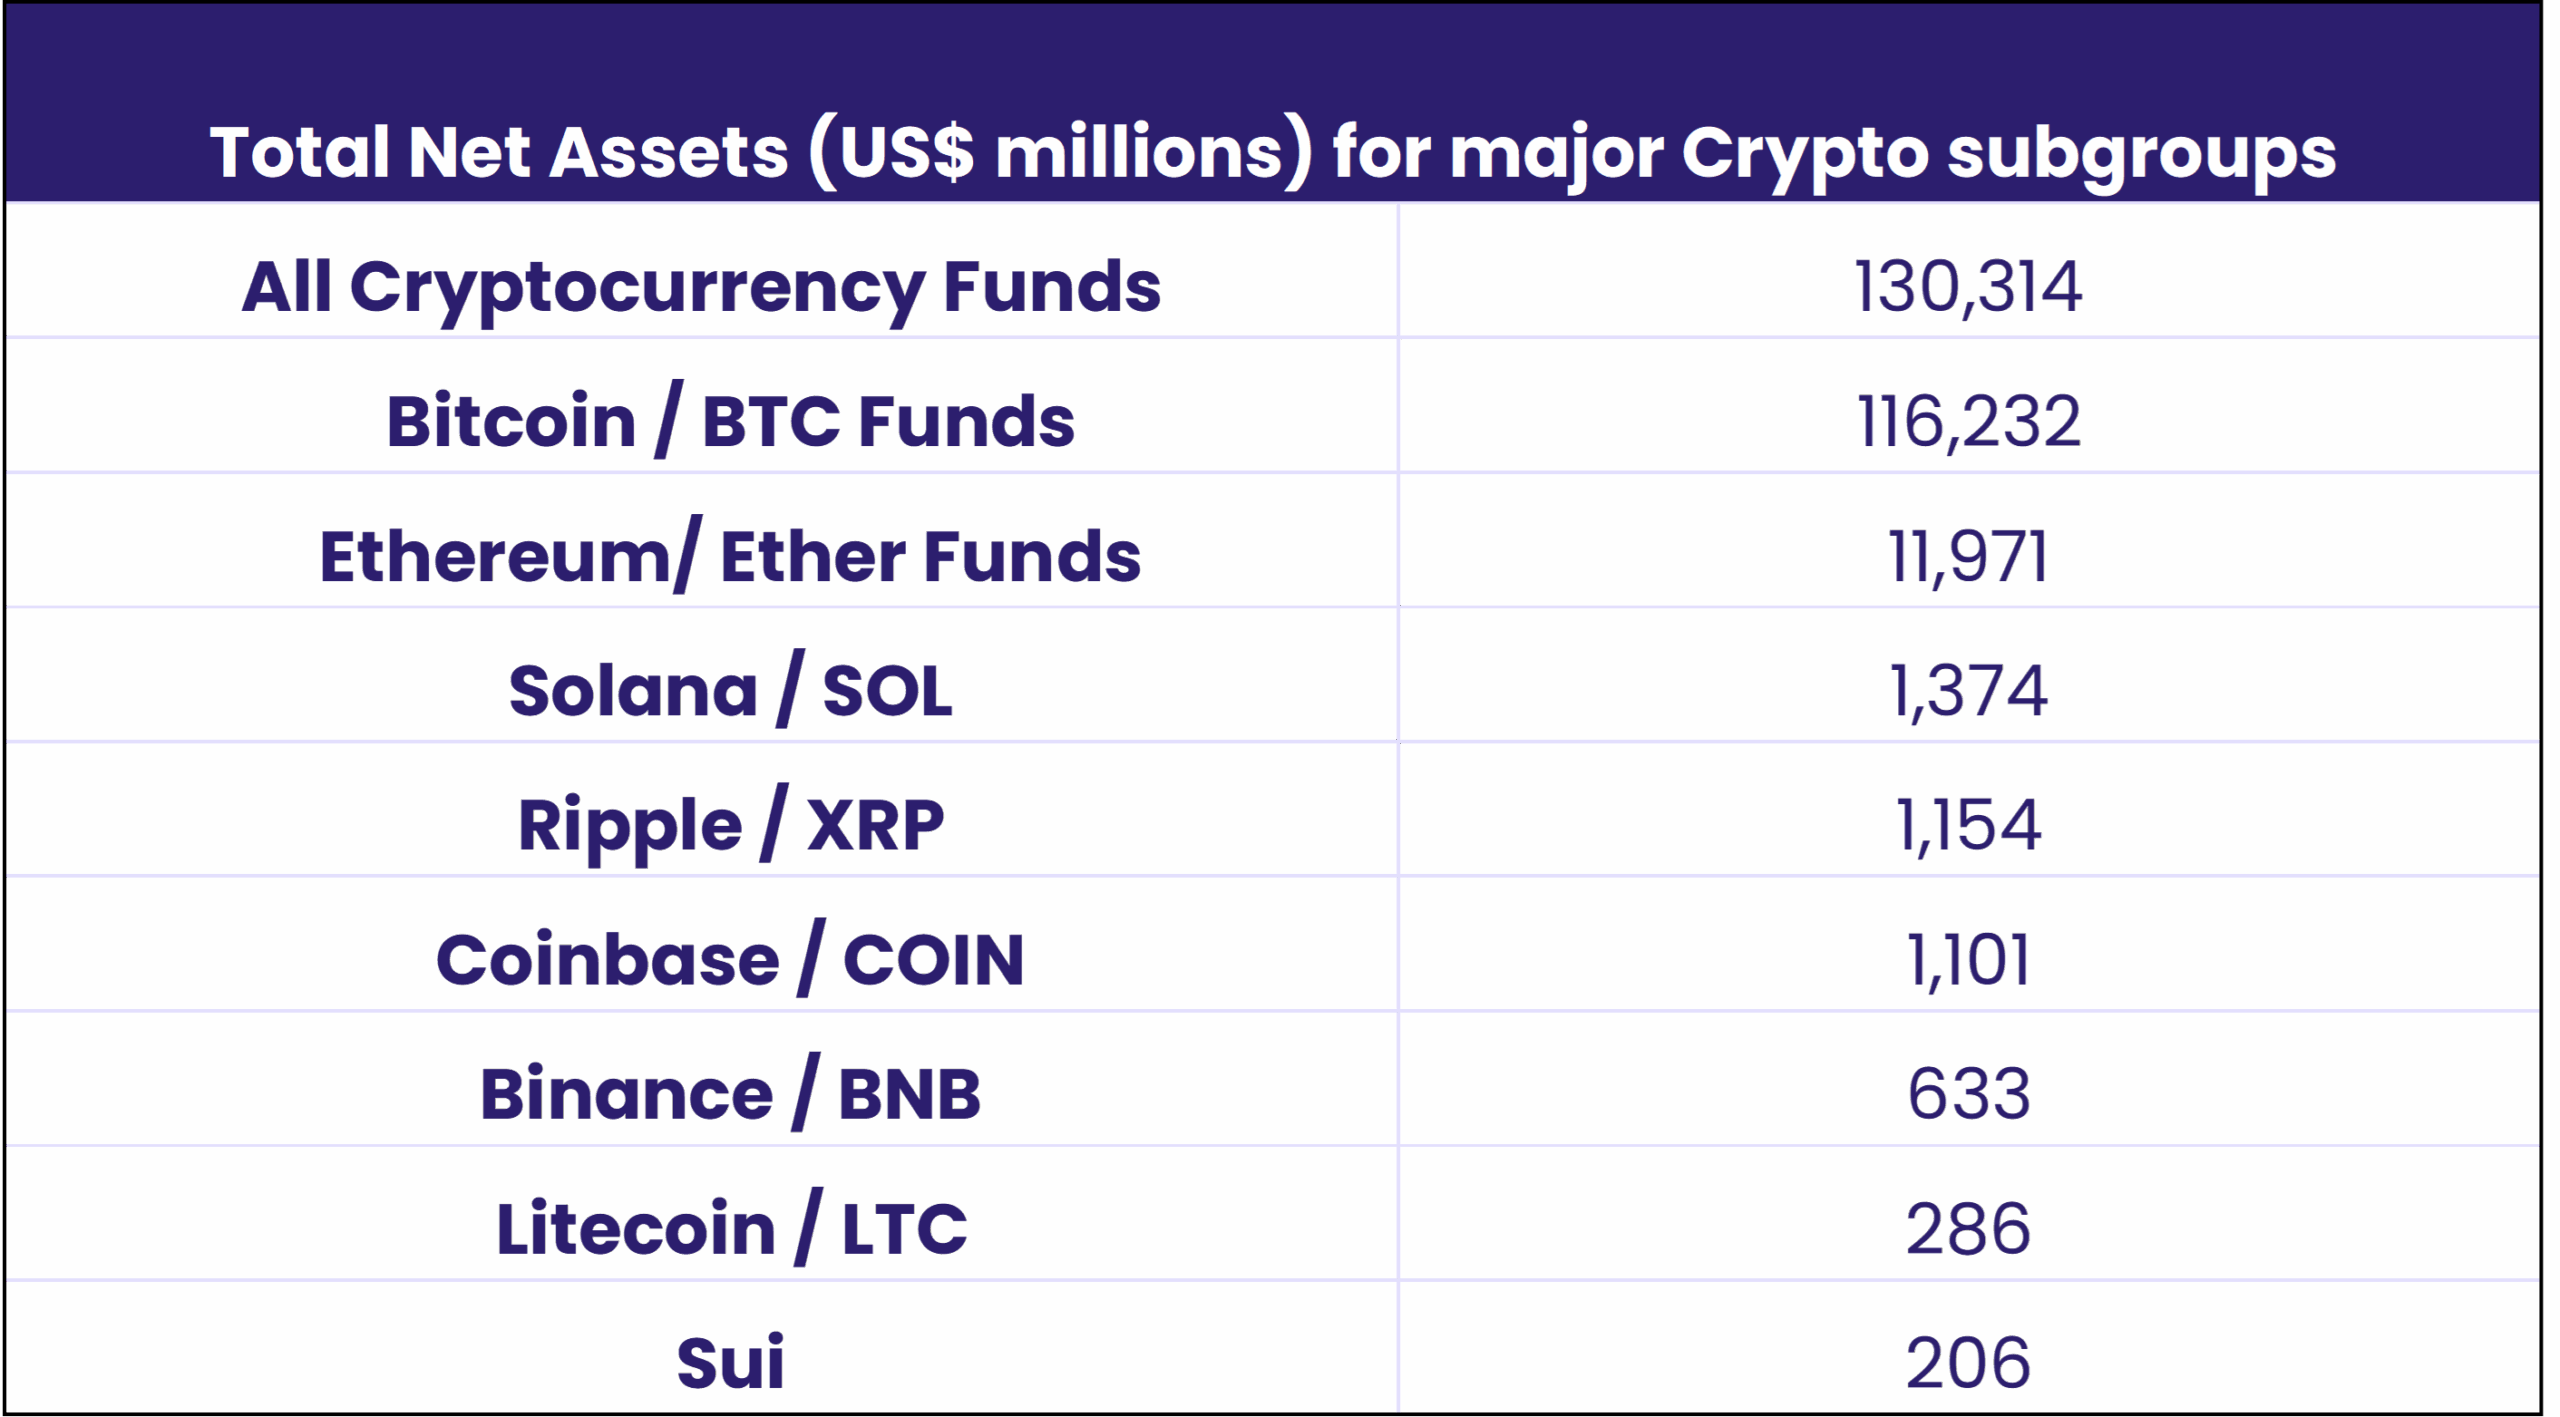
 Among the Cryptocurrency Funds tracked by EPFR, many cover a niche single-stock or crypto exchange platform (like Bitcoin, Ethereum, Solana, Coinbase, etc.) and there are funds whose mandates encompass blockchain/protocol platforms, decentralized finance (DeFi) and their applications, exchanges and ecosystems, and other solutions.
Two-thirds of the Cryptocurrency Fund universe (by AuM) track Bitcoin. This is followed by Ethereum funds with just $12 billion in AuM, and the next three largest groups with an AuM of just about $1 billion are Solana, Ripple and Coinbase.
Crypto meets PCA
With our universe of Cryptocurrency Funds now defined — and more niche, single-asset funds tagged — we can take a deeper dive into their behavior and try to answer key questions about this asset class. To that end, we employ principal components analysis (PCA) to identify common patterns in fund returns.
For PCA analysis to yield meaningful results requires a sufficient number of funds reporting consistently over a reasonable time frame. EPFR’s dataset now includes 108 funds that have reported monthly returns without interruption over the past 24 months.
For our analysis, we looked at the returns of each of these consistently reporting funds over the past 24 months. Each fund is categorized by 24 data points that represent every month’s return between May 2023 and April 2025. From this, we can establish 24 linear combinations or risk factors that encompass geography, volatility of returns, investment styles and other key risk metrics.
The riskiest of these combinations becomes the first principal component, with the next strongest becoming the second. The remaining, weaker risk factors are then discarded. The two factors that make the cut are used as the axes that allow us to represent our data in two dimensions by way of a simple dot-plot chart.
Reading the digital tea leaves
Encouragingly, PCA of EPFR’s custom asset groupings — such as those focused on Bitcoin, Ether, Ripple, and Solana — shows a tendency to cluster together. This clustering indicates that the funds within each of these groups have similar return profiles, which not only validates our classification framework but also suggests that these assets are driving distinct and coherent performance patterns within the fund universe.
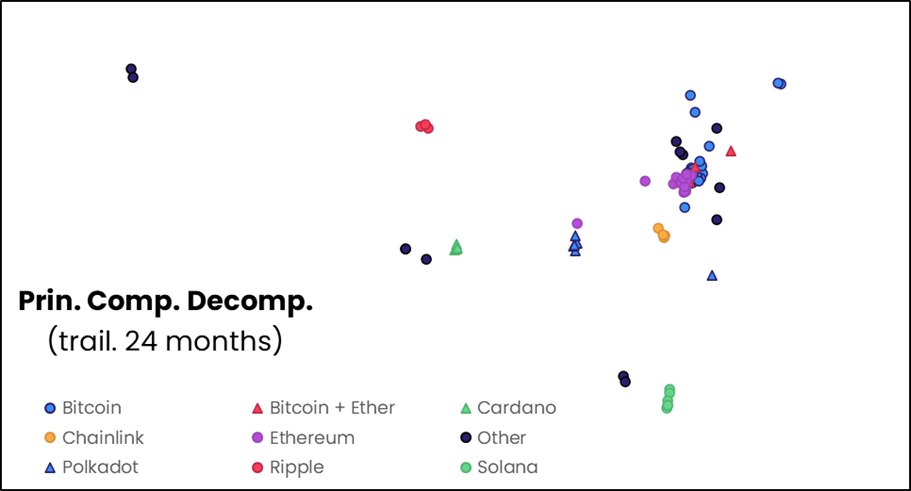
Furthermore, Ether and Bitcoin funds also form a tight cluster, with Chainlink and Polkadot funds positioned nearby — suggesting shared return characteristics across these assets as well.
The clustering behavior seen in the PCA is an encouraging sign, as it suggests that despite the volatility and fragmentation often associated with the crypto market, the fund landscape is beginning to exhibit some degree of structural coherence. This provides a foundation upon which more refined portfolio construction, risk management, and asset allocation strategies can be built.
Did you find this useful? Get our EPFR Insights delivered to your inbox.