Driven by supply chain, labor market and energy supply issues, consumer prices are surging at a rate last seen in the 1970s and 1980s. To what degree this could have been foreseen is the subject of increasingly acrimonious debate.
Certainly, users of EPFR data saw flows into Inflation Protected Bond Funds accelerate to above average levels in 2Q20 and stay there until the US Federal Reserve acknowledged in December 2021 that inflation will not be as transitory as they had hoped.
However, that signal – while clear – was a blunt one. In this Quant’s Corner, we will explore the impact changes in the Consumer Price Index (CPI) have on fund manager sentiment changes together with the CPI, and whether or not this relationship can predict future changes in the CPI.
Filling the right buckets
To start, we need to categorize certain fund groups into two buckets: asset classes that fare reasonably well in an inflationary environment (inflation assets) and those that do not (anti-inflation assets).
Inflation asset classes include Commodity Equity Funds, Financial and Real Estate Sector Funds, Value Equity Funds and Inflation Protected Bond Funds. Anti-inflation asset classes are composed of US Municipal Bond Funds, Growth Equity Funds, Investment Grade Bond Funds, High Yield Bond Funds and Consumer Goods Sector Funds.
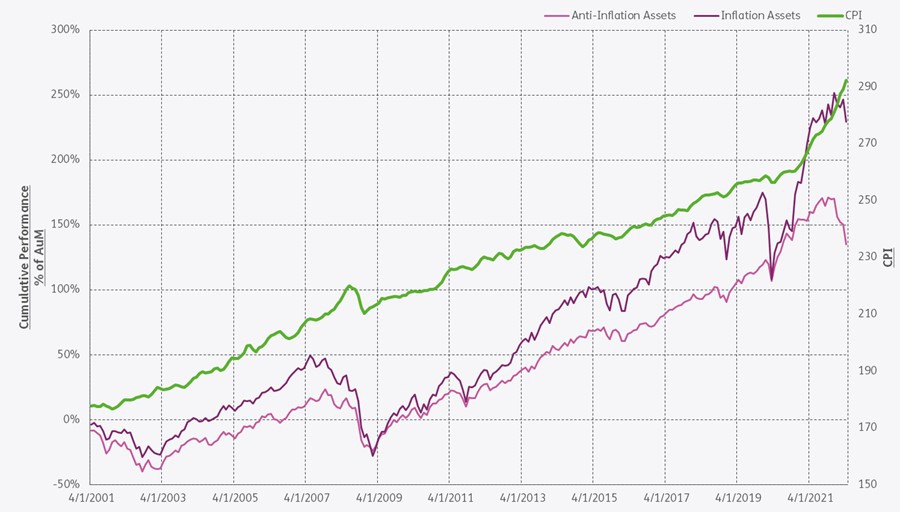
Historically, fund groups dedicated to inflation assets are more sensitive to sharp increases in the CPI, especially when it comes to the pace of redemptions. The 2008 financial crisis, 2010 flash crash, August 2011 stock markets fall and the initial stages of the Covid pandemic in 2020 were all marked by a sharp decline in the inflation assets fund group performance.
Fund groups in the anti-inflation bucket are viewed as safer when inflation is on the rise, experiencing lower redemption rates and recovering more quickly. This time, however, things are playing out differently. In recent months, the fund groups dedicated to anti-inflation assets fund group have suffered greater losses (see chart below).
The big picture holds up
Recent performance notwithstanding, we do see a very strong positive sentiment towards anti-inflation asset fund groups in flow as a percentage of total AuM terms for the period between 2Q20 and 1Q22. The trend (see Chart 2 below) actually starts back in early 2017, well before the CPI took off in 2Q21.
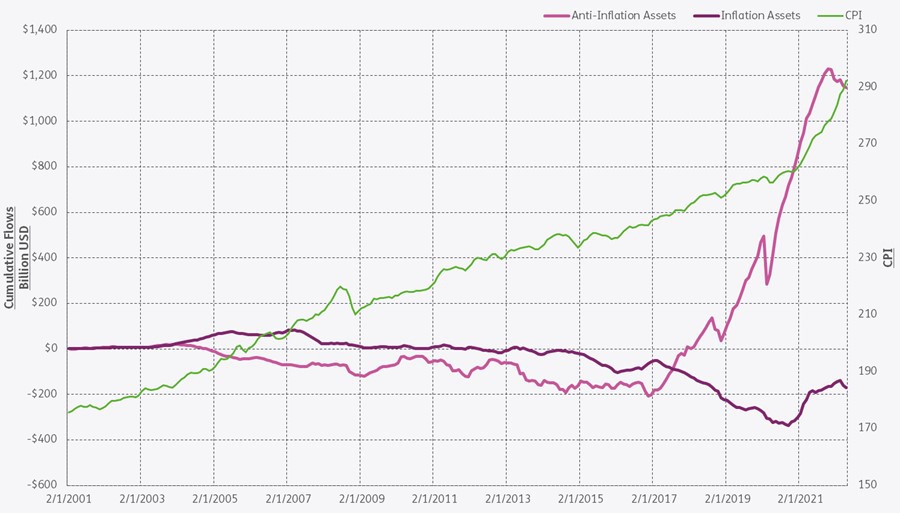
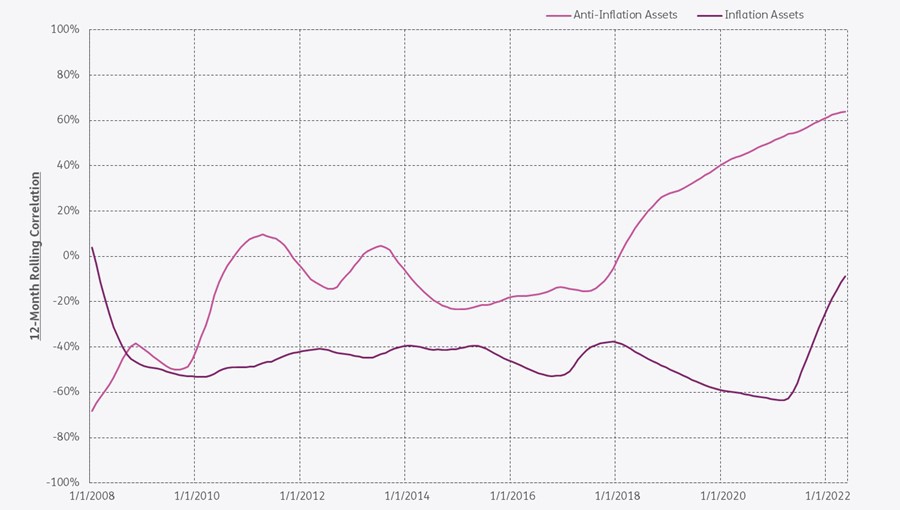
In the next stage of our analysis, we looked at the correlations of the two groupings with the CPI. Because we are looking for predictive signals, we applied a two-month lag to the flow data as EPFR’s monthly flow data (which is available on the 16th of the following month) to examine, for example, the correlation between 12-month cumulative flow through January and March’s CPI number.
Chart 3 below illustrates a 12-month rolling correlation between the inflation and anti-inflation asset fund groups versus CPI. It turns out that the inflation assets group is negatively correlated, albeit slightly, with the CPI while anti-inflation asset fund group flows have a 63.9% leading correlation with the index.
Pointing to the new normal?
Although the past two months have seen outflows from the anti-inflation bucket of funds, the overall trend over the past 12 months suggests that we have yet to see inflation peak.
Because inflation has been so subdued for much of the past decade, back-testing this signal may prove less useful than calibrating it as we move forward. So this is a line of inquiry we will revisit in the future when we have more observed history to work with.
Did you find this useful? Get our EPFR Insights delivered to your inbox.

