With the impact of the Covid-19 virus on day-to-day life and the global economy growing by leaps and bounds, fund flows are reflecting the biggest flight to safety by investors since the financial crisis in 2007-08.
Nowhere is this clearer than in the latest data for US Money Market Funds. Buoyed in 2018 by the accelerating pace of US interest rate hikes and in 2019 by the Sino-US trade tensions, already robust flows have gone into overdrive during 1Q20. Between March 3-19 these funds absorbed over $320 billion – more than half of last year’s record-setting total (see Figure 1 below).
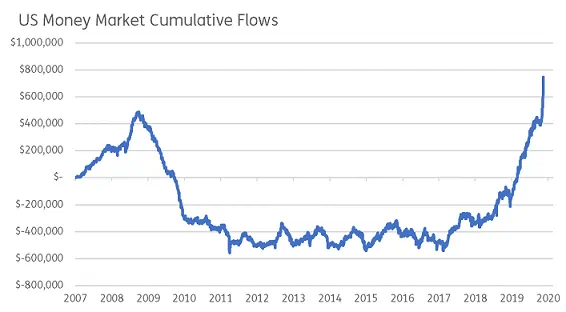
Figure 1: Cumulative Flows to US Money Market Funds
That this highly liquid fund group attracts strong flows during times of stress, and hence can help investors gauge levels of fear, is well known. But quantitative analysis of those flows can generate some less well known, and arguably more actionable signals.
Banking on the ‘strong getting stronger’
While US Money Market Funds can usually count on an influx of fresh cash when the investment climate turns colder, the same is not true for Money Market Fund groups in other major markets such as Japan, the Eurozone and UK.
Take, for example, the flows for UK Money Market Funds during and after the Brexit referendum in mid-2016. Given the magnitude of the shock at the result, it would be logical to expect a surge in inflows into this fund group. But in this case, the opposite happened (See Figure 2).
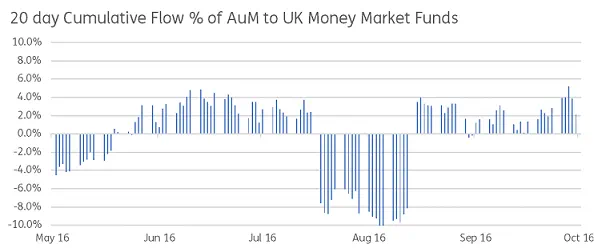
Figure 2: 20-day flows to UK Money Market Funds during and after the ‘Brexit’ vote
Instead of increasing their allocation to UK Money Market Funds, investors moved their money out of that group while boosting flows to US Money Market Funds (See Figure 3). What happened back in 2016 is happening again now, with the magnitude of the move to US funds similar to the post-Brexit vote spike.
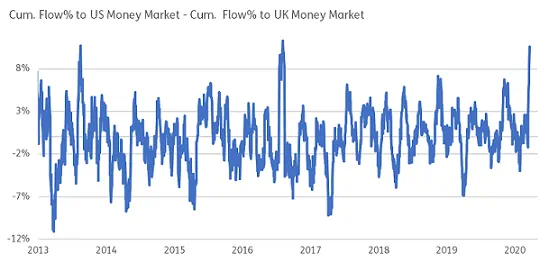
Figure 3: Spread between 20-day flow % to US MM Funds vs UK MM Funds
Although interest rate differentials and differences in the regulatory environment may explain some of the tilt towards US funds, we suspect the main reason is the difference between the performance of the respective currencies.
In their scramble for safe haven assets, investors have bid up the US dollar, and the recent dollar strength across the board has made US Money Market funds more attractive. As Figure 4 below illustrates, all Euro, GBP, or Japanese yen-denominated Money Market Funds have seen outflows over the past month, while the US dollar-denominated money funds have received substantial inflows.
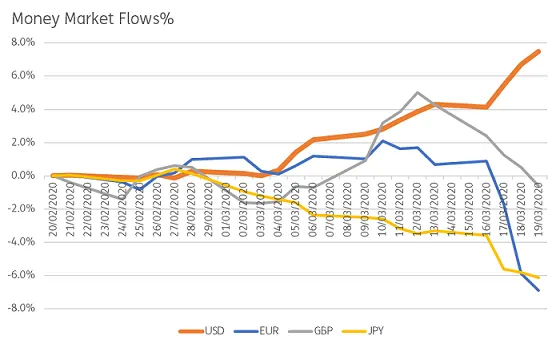
Figure 4: Cumulative Money Market Flows % of AuM since 21 Feb 2020
Profiting from this FX signal
To explore this relationship between money market funds and currency performances, and test its historical evolution, we run a simple analysis utilizing the flow-based indicator created by Srimurthy et al.[1].
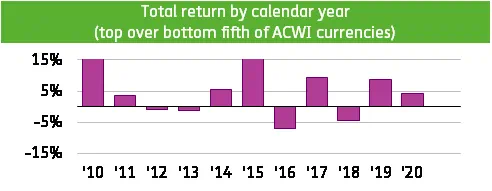
Looking at 20-day flows to money market funds of G10 countries from 2010, we rank currencies by flows received and generate 5 baskets (Q1-Q5). Then we ‘go long’ in currencies that have received inflows (or relatively lower outflows) which are in the top quintile and ‘go short’ in currencies that have received outflows (or relatively lower inflows), and are ranked in Q5.
The results are reported in Figure 5. The Sharpe ratio is 0.43, with an annualized return compared to an equally weighted benchmark of 3.6%.

Figure 5: G10 Money Market Flow-based indicator back test
Reviewing money market funds, especially in times of stress, clearly has the potential to generate signals for different currencies tied to investors broader risk appetite.
Did you find this useful? Get our EPFR Insights delivered to your inbox.

