EPFR’s data can be filtered in dozens of ways, including sifting through lists of individual funds to create bespoke groups. A recent example is the selection of utility sector funds with water mandates into a custom group.
As it happens, these funds are in focus and in demand. With water getting scarcer in many parts of the world, governments boosting budgets for “green” infrastructure and water’s key role in next generation industries – by some estimates the average semiconductor plant requires over 3 million gallons of clean water a day – investors see both need and opportunity.
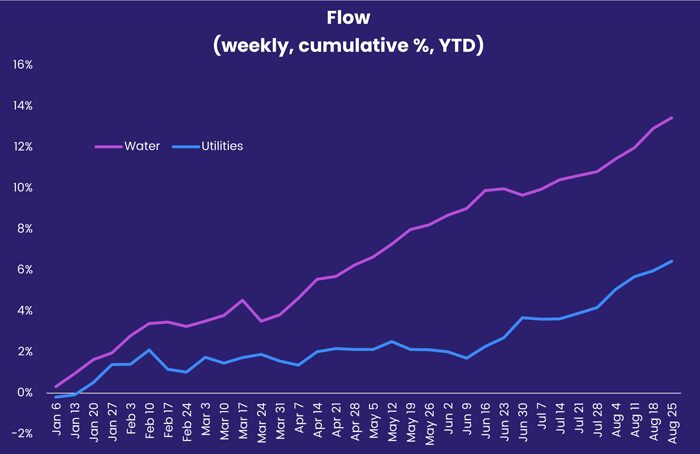
The upshot? Water Funds had, through August, posted inflows 31 of the 34 weeks year-to-date and have outperformed the broader Utilities Sector Fund group.
From a quantitative perspective, this trend poses a number of questions. How does it tie in with the environmental, social and governance (ESG) theme that has been a major investment factor in recent year? What are the key correlations?
Out of equilibrium
For many, the correlation that needs to be explored is the role climate change is playing in the water-related stress that has manifested itself globally in 2021.
Signs of stress are everywhere. Long running droughts have left the northern coast of the Mediterranean and West Coast of the US in the grips of historic forest fires. Water shortages are hobbling Brazil’s agriculture sector and hydroelectric production, while in Mexico authorities are releasing silver iodide into the clouds to stimulate rain.
On the other side of the coin, Northern Europe, the East Coast of the US, India and parts of China have experienced exceptional levels of flooding this year that have damaged water supply and treatment infrastructure.
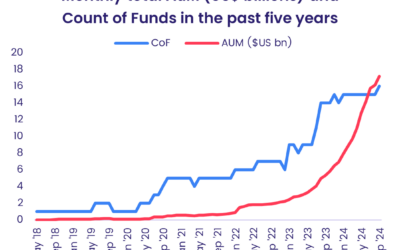
Against this backdrop, Water Funds are enjoying strong investor flows. EPFR has tracked Water Funds since March of 2006. Since then, the assets managed by those funds have grown from $734 million to $41.324 billion. In this year alone, the collective AUM of EPFR-tracked Water Funds has grown by $11.654 billion.
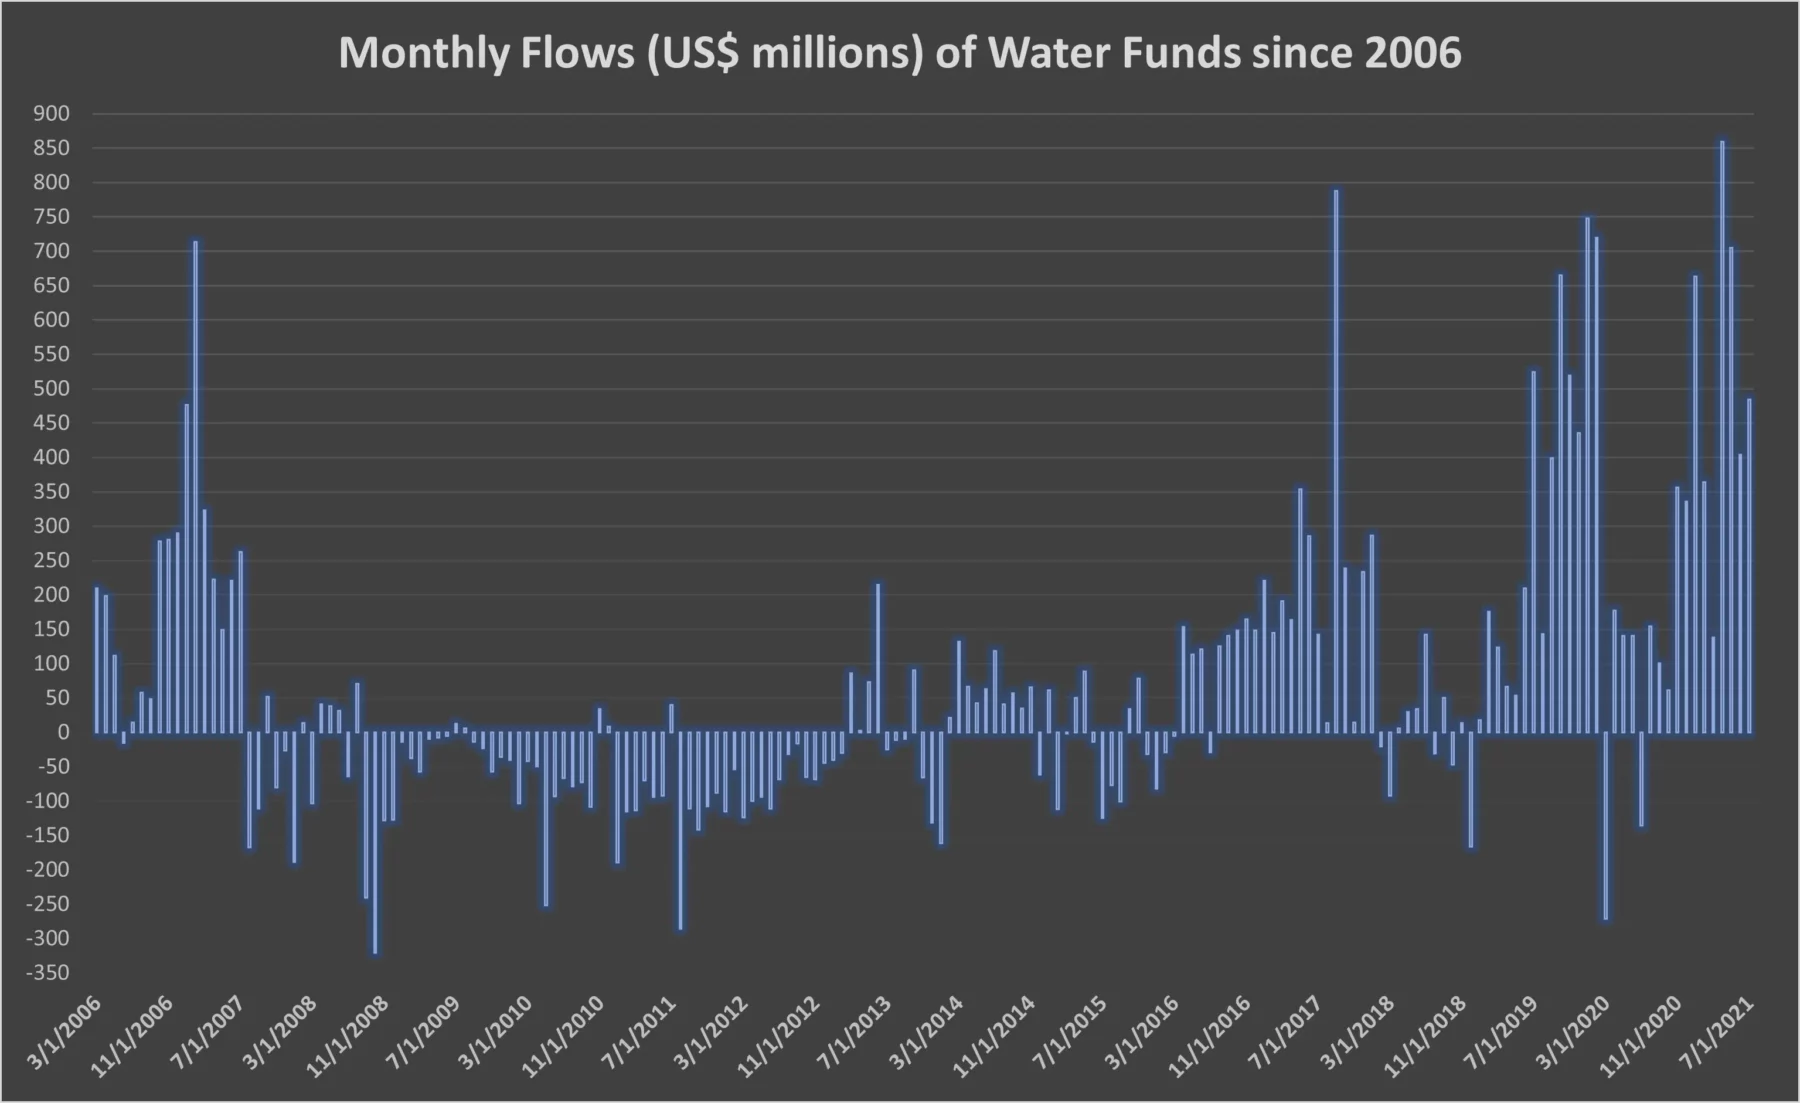
Looking at historical data, the flows seen in the past three years are exceptional. Since 1Q19 there have been only two months where net flows were negative. In April of this year, Water Funds recorded the highest monthly inflow — $859 million — since 2006.
In relative terms, these funds are doing better than the overall group when it comes to attracting new money.
A good performance, but dancing to what tune?
Water Funds are not just pulling in fresh money. They are delivering returns. Again, when compared against all Utilities Sector Funds, Water Funds have been the better bet YTD.
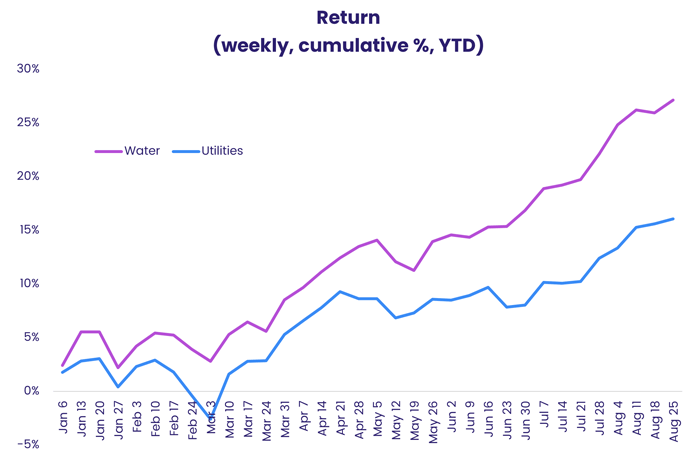
What is not so clear, and requires further quantitative analysis, are the factors contributing to this outperformance. One obvious candidate, already mentioned, is the broad shift to ESG assets. The performance gap between SI/ESG Utilities Sector Funds and non-SRI/ESG Utilities Sector Funds YTD is roughly the same as the Water versus all Utility Sector Fund groups.
Given water’s central role in agriculture, many forms of manufacturing, both public and private hygiene and health and climate cycles, the correlation between Water Funds and investment factors is unlikely to stop at SRI/ESG.
Following flows to their source
As part of the basic research and organization needed to do more sophisticated quantitative research, EPFR has developed some stock level dashboards to track factors such as flow momentum and ownership concentration.
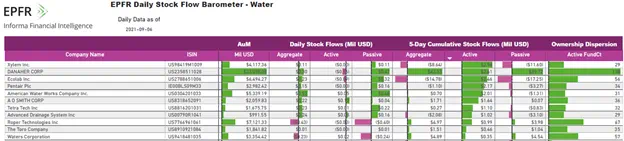
In future blogs, we will discuss how we have used this foundational work to explore correlations and signals stemming from human interaction with the most fundamental of commodities, water.
Did you find this useful? Get our EPFR Insights delivered to your inbox.