In the cases that usually catch their eye, the ETF’s return is trending down — as expected – in response to deteriorating market conditions but flows are, unexpectedly, moving in the opposite direction.
Given our awareness of these types of flows, and the granularity of our databases, EPFR’s quant team decided it was high time they dove into our ETF database and conducted a systematic analysis of these events.
As Trump would say, the quintessential example
A classic example of this relates to the aftermath of the 2016 US Presidential election which took place on November 8. The day after the election, at 2:45 in the morning in New York, television networks called the election for then-candidate Donald Trump against the Democratic contender, Hillary Clinton. That day, there was a 27% percent inflow (in AUM terms) into the iShares Mexico ETF even as its value dropped by 9%. The following day, the fund’s value fell by another 8% but inflows came in at 3% of AUM. The day after that the ETF fell a further 3% while inflows still held strong at 6%.
What was going on?
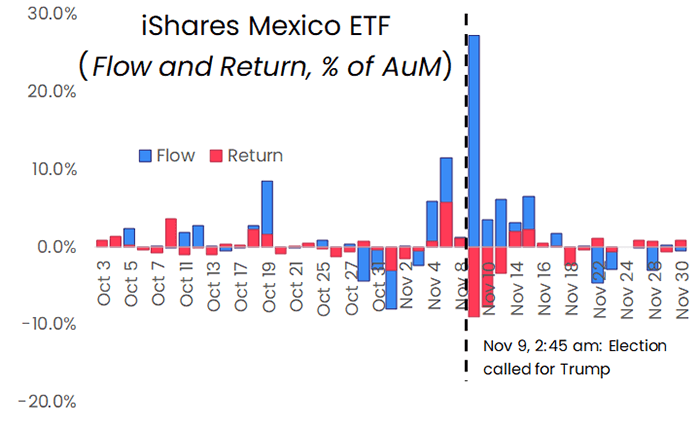
Given the themes that Trump campaigned on during the run-up to the election, markets were in no doubt that a victory for the Republican candidate was bad for Mexican stocks. So we suspect that this kind of anomalous flow, contrary to fundamentals, is driven by high demand for the ETF units in order to express short interest.
When the market wants to capitalize on a bearish view – in this case, the outlook for Mexican trade with the US – they look for securities to short. This drives up demand for these instruments, their cost-to-borrow surges and, in turn, Wall Street is incentivized to make more units of the ETF to lend out for shorting. That causes them to scrape together basket ingredients, present them to the ETF provider who, in turn, hands precious units of the coveted ETF back over.
Taxonomy of an anomaly
Using the Mexico ETF as a quintessential example of contrarian flows, we formulated a definition of the phenomenon. Considering equity ETFs, we looked for all cases where:
- flows, as a percentage of assets, were more than 3%
- fund return was -3% or lower
- the spread between flow and return was at least 35%
Reviewing our full data history uncovered 1,700+ such cases. After throwing away many of the results tied to leveraged funds and cases where daily flow exceeded 200% of starting assets, we were left with 809 events to explore.
Digging into each of these, we identified more cases where event-driven market stress triggered contrarian flows. For example, on 24th February last year, the same day Russian troops poured into Ukraine, the KINDEX MSCI Russia ETF experienced a 30% inflow while suffering a 9% drop in value.
A more recent case pertains to cryptocurrencies. On 18th January this year, the US Justice Department in partnership with the Treasury Department and French law enforcement announced the arrest of the Russian founder of Bizlato, a Hong Kong-registered cryptocurrency exchange, and charged him with money laundering and other crimes. That day, the WisdomTree Blockchain UCITS ETF suffered an 8% value drop while experiencing a 185% inflow. Two weeks later, on 3rd February, it was the turn of the Valkyrie Bitcoin Miners ETF, which suffered a 6% drop while experiencing a 42% inflow.
In terms of sheer scale, however, Brexit takes the cake. Britain’s vote to leave the European Union was held on 23rd June 2016. The next day, seven ETFs experienced anomalous flows: on average returns dropped 4% while inflows came in at 50% of starting AUM. Two days later, on the 27th, a Monday, four more ETFs were hit, dropping 10% while garnering 75% inflows.
Making one-offs systematic
With all that said, however, many clients have little interest in carefully classifying these cases, mapping them neatly to market events and adding them proudly to their stamp collection. So, what do all these events mean collectively?
For each case, we utilized – where available — the fund return from 20 days prior to 20 days post each anomaly. There were 78 cases where the fund return, for any of the 21 days, was not available and those funds were removed from the analysis. Plotted below is the equal-weight average return of the 731 funds, compounded from the beginning of the 21-day period.
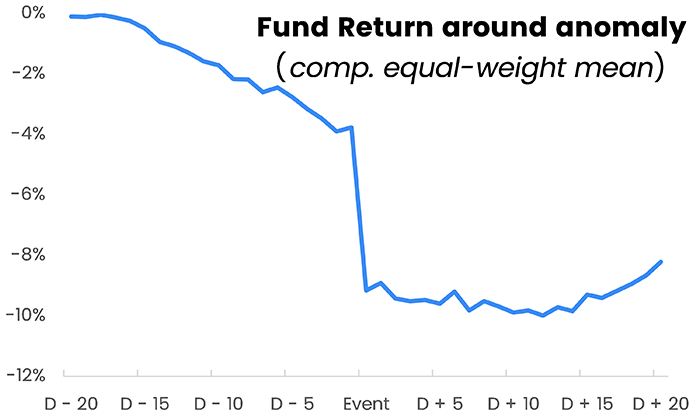
As the chart shows, these anomalies are presaged by market events. Return drifts lower as the day of the anomaly approaches, then the fund falls sharply on the day of the anomaly itself (labelled “event” in the chart). The fund continues to drift lower post the event (so the shorts do make some money), and, finally, three weeks later the fund drifts up from its low.
Monthly returns around the average anomaly
Doing the same process with months (20 months prior to 20 months post the month of the anomaly), we can conclude that, provided the fund survives, the anomaly is actually a buying opportunity!
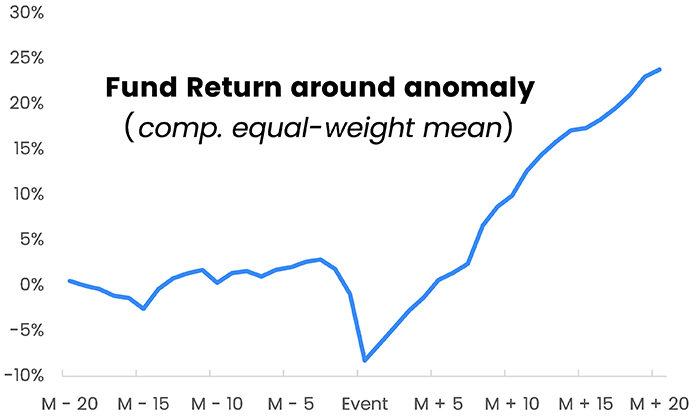
The issue of fund survival is actually important. For instance, according to a Korea Times article dated 6th March ’22, trading of the KINDEX MSCI Russia ETF – the only Russia-related ETF sold in South Korea, and also the same ETF that experienced massive inflows the day Russia invaded Ukraine – was to be temporarily halted until further notice.
Future blogs involving contrarian flows may study how short interest evolves around the anomaly possibly incorporating Fed data and data from Caretta, one of our partners.
Did you find this useful? Get our EPFR Insights delivered to your inbox.

