How to Gain a Deeper Understanding of Investor Sentiment
What is investor sentiment?
Sentiment, by definition, refers to an opinion, a view of or attitude towards a situation or event. Investor sentiment reflects the collective feelings or perceptions driving behaviours – to sell, buy or hold – of the investing community within markets globally.
Also referred to as market sentiment, this prevailing attitude towards a company, sector or region is determined by understanding news and media, important economic data – GDP, Inflation rates and CPI – political events, trading volumes and volatility, consumer behaviour and other factors.
Positive investor sentiment is generally indicated by inflows to a given stock, sector or market, whereas negative investor sentiment is indicated by outflows. It can also be described as bullish, where investors are optimistic and expect to gain from prices increasing or assets performing well in the near future; or bearish, a cautionary stance with the expectation for prices to fall.
The value of market sentiment analysis
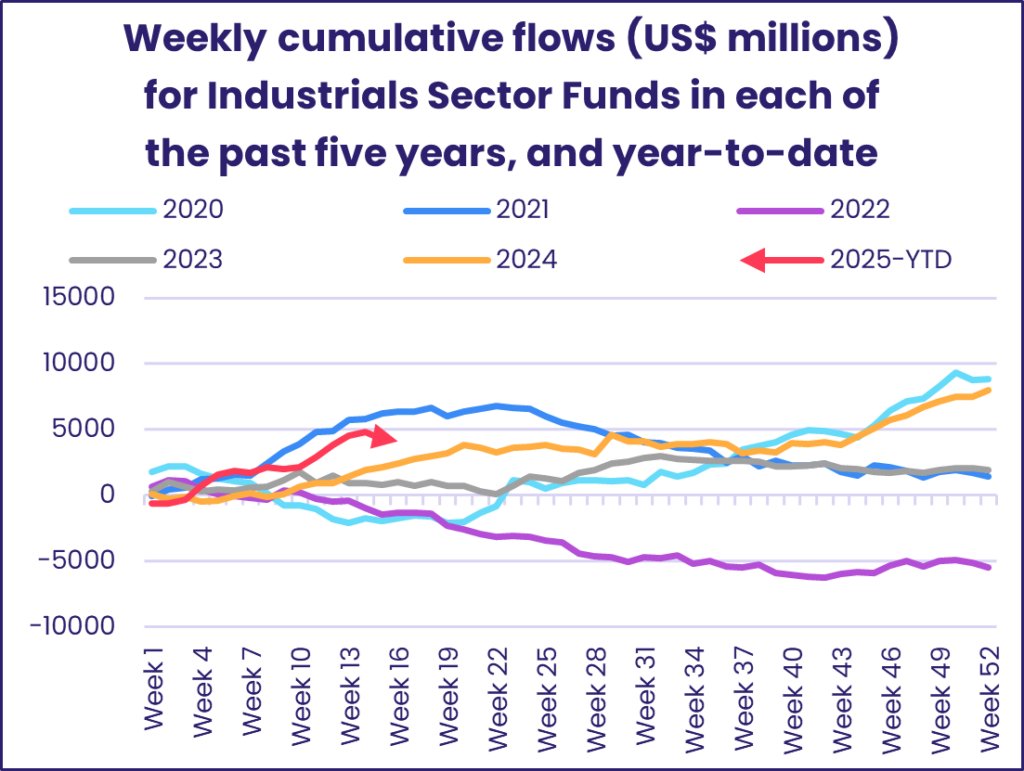
In their quest for competitive advantage, buy-side and sell-side teams are continually in search of fresh sources of insight. Measuring and monitoring investor sentiment data offers the global investment community a deeper understanding of market behaviours. Fund Flows data offered by EPFR, in its simplest form, tells stories of positive or negative sentiment, based on inflows or outflows to specific assets.
The unique vantage point of fund flows, coupled with allocations data, reveals what investors are thinking, buying and selling, as well as how they are positioned across different assets or sectors. This information helps investors understand which sectors are currently favoured or avoided, track market sentiment shifts over time, and make informed portfolio adjustments based on the collective wisdom of the market.
With empirical data on flows across countries, sectors, industries and stocks, connecting the dots between key geopolitical events and their impact on investor sentiment or markets is achievable. Such insights are valuable for both discretionary and quantitative investment processes, informing top-down asset allocation decisions and bottom-up stock screening strategies.
To what extent does investor sentiment impact the market?
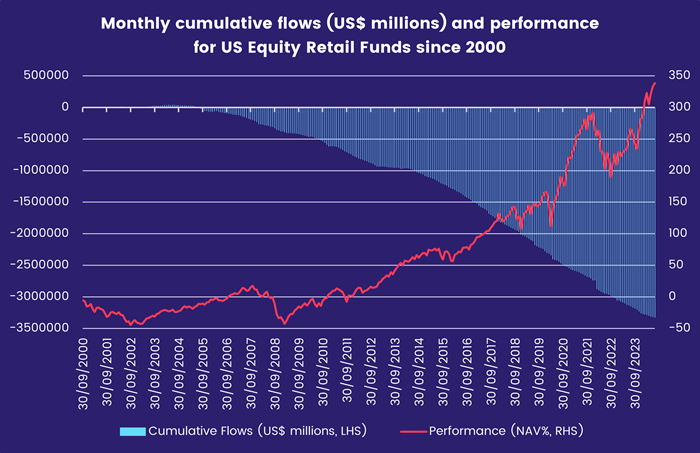
Investor sentiment is a dynamic force that exerts a tangible influence over market movements. At the beginning of the COVID-19 pandemic, for example, the S&P 500 experienced a sharp decline. With businesses closing and a pervasive sense of fear, bearish sentiment drove the market down rapidly in just over a month. This drop occurred before substantial evidence justified it.
Another well-publicized example is the Dot-Com Bubble. During the late 1990s, investor enthusiasm for internet-related companies drove stock prices to unsustainable levels, despite many of these companies having little to no earnings or viable business models. When stock market sentiment shifted, the bubble burst, causing a significant market downturn.
Analysing and predicting market movements with sentiment data allows investors to capitalise on opportunities early or hedge against changes in market psychology.
Measuring investor sentiment
When using market sentiment in investment strategies, teams often turn to popular investment sentiment indicators. These include:
- The Volatility Index (VIX):
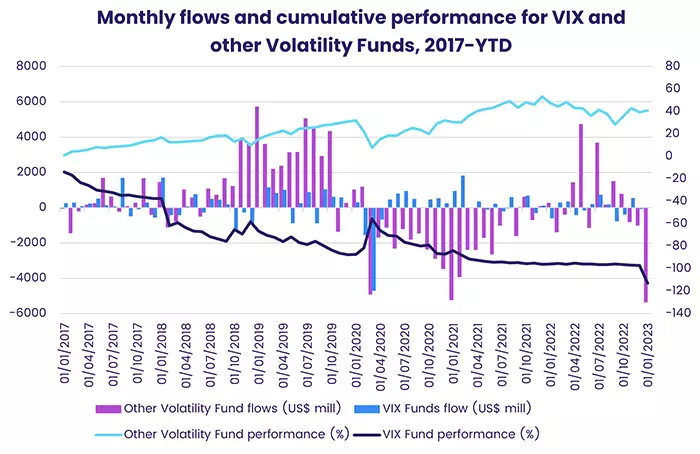
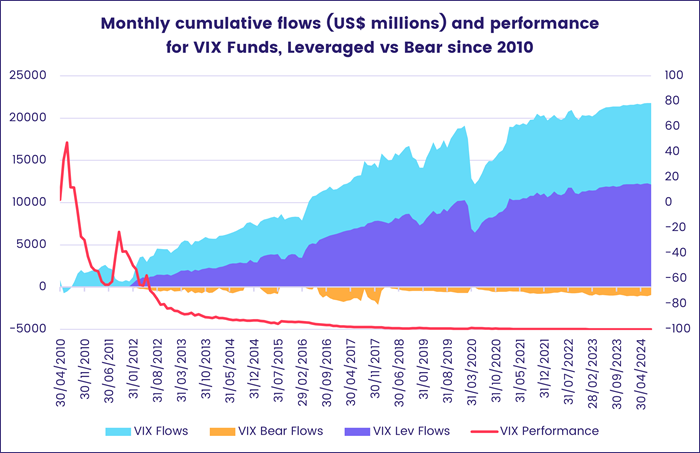
Calculated by the Chicago Board Options Exchange (CBOE), the Volatility Index (VIX) represents the US equity market’s expectations of volatility for the upcoming 30 days. Unlike realised (or actual) volatility, which looks at the fluctuation of past prices, the VIX is a forward-looking measure based on options of the S&P 500 index. - The High-Low Index:
This market breadth indicator is designed to compare the number of stocks hitting their 52-week highs to those reaching their 52-week lows. It helps gauge overall market direction and vitality. A High-Low Index value above 70 generally indicates bullish sentiment, while a value below 30 signifies bearish sentiment. This is often applied to major indexes like the S&P 500 or Nasdaq 100. - The Bullish Percent Index (BPI):
Developed by ChartCraft (later known as Investors Intelligence), this breadth indicator is based on point and figure charts, and measures the percentage of stocks with bullish patterns within a specific index. As with the High-Low Index, a BPI of 70% or higher indicates extreme optimism and potentially overpriced stocks, while readings of 30% or below indicate negative sentiment and an oversold market. - Moving Averages:
Moving averages are a common technical indicator used to smooth out price data and reveal the underlying trend of a stock or index. By averaging the prices over a specific period, such as 50 or 200 days, moving averages help to identify whether a market is trending upward or downward. When shorter-term moving averages cross longer-term ones (e.g., the 50-day moving average crossing above the 200-day moving average), it can indicate a shift in investor sentiment towards a more bullish outlook. Conversely, when shorter-term averages cross below longer-term averages, it may signal bearish sentiment. - Other commonly-used indicators:
These include Gross Domestic Product (GDP), unemployment rate, inflation rate, the Consumer Price Index (CPI) and Producer Price Index (PPI), retail sales, industrial production, housing market indicators, business sentiment (PMI), the Commodity Channel Index (CCI) and the US earnings.
EPFR provides a unique view on investor and fund manager sentiment
Where a well-used investor sentiment index provides a mainstream view, alternative sources of investor sentiment data can add context and clarity. To this end, EPFR provides comprehensive insights by tracking institutional and retail investor flows, as well as fund manager allocations worldwide, with breakdowns by country, sector and industry.
Our data covers a wide range of markets, including developed, frontier, emerging and offshore areas, offering a holistic view of where money is moving, and which funds or managers are benefiting. This granular data – down to the manager, fund or share-class level – provides nuanced insights into key market trends such as active versus passive investments, multi-asset strategies and more.
With real-time updates and monthly allocation data, EPFR captures macro shifts within global fund portfolios, providing detailed insights that help investors anticipate market movements, identify potential opportunities or risks, and make informed decisions. Our data highlights asset momentum and turning points, allowing investors to effectively adjust their strategies based on current market conditions and trends.
Regular updates ensure that our insights stay relevant, reflecting the latest changes in manager positions and overall market sentiment. This enables users to effectively communicate compelling narratives about current investor sentiment to their clients.
FAQ
1. What is investor sentiment?
Investor sentiment, by definition, refers to an opinion, a view of or attitude towards a situation or event. Investor sentiment reflects the collective feelings or perceptions driving behaviours – to sell, buy or hold – of the investing community within markets globally.
2. What can investor sentiment trends tell you about the market?
Positive investor or stock market sentiment, indicates money being invested into a specific area, which can drive market upswings. Negative sentiment, contrarily, can trigger deeper sell-offs.
3. Why is it important to understand market sentiment?
Market sentiment analysis provides valuable insights into market trends, helps anticipate shifts in investor behaviour, and informs timely portfolio adjustments to capitalise on opportunities or mitigate risks effectively.
4. Sentiment trading strategies: What’s the best approach?
Stock sentiment analysis is valuable regardless of whether an investor takes a conventional or contrarian approach. For conventional investors, understanding sentiment helps align with broader market trends and optimise timing. For contrarian investors, it highlights opportunities to go against the grain and capitalise on market overreactions. In both cases, having a clear picture of market sentiment allows for more strategic and effective investment decisions.
5. What tools are being used for measuring investor sentiment?
A number of popular indicators provide insights into investor sentiment and potential market movements. EPFR Fund Flows and Allocations data is one of the best proxies for investor sentiment trends, with the ability to view flows into and out of major markets, sectors or specific assets. This, coupled with insights provided by our in-house qualitative and quantitative research teams that shed light on the narrative surrounding major market movements, gives EPFR users an in-depth view of market sentiment.
6. Can market sentiment analysis inform long-term investment strategies?
While investor sentiment data provides useful market insights and helps to refine timing decisions, using it as the primary basis for long-term investment strategies could introduce risk. Overemphasis on sentiment over time could detract from focusing on fundamentals like earnings growth, market position and economic conditions.
Next steps
Investor sentiment is a powerful force that can significantly impact market movements. By understanding and analysing this collective psychology, your team can gain a unique vantage point for identifying opportunities and mitigating risks.
If you’re interested in exploring how EPFR can help you unlock deeper insights into market sentiment, we’d love to hear from you.
Leading research & market intelligence
The global navigator is a weekly summary of inflows and outflows within Equity (Developed and Emerging Markets, Sectors) and Bond Funds, looking closely at positive or negative sentiment trends evolving at the single country and asset class fund level.
Will US policy respond to reality’s bite?
Investors keep shuffling their hands
