EPFR’s daily flow data is usually released around 5 pm Eastern Standard Time (EST) the following business day. That is – narrowly — too late to catch the T + 1 market close. Hence, our internal back tests always incorporate a two-day delay.
EPFR does offer, however, an early-release option for its daily data. Clients can get premium daily flow data on a rolling basis, with sequentially more comprehensive deliveries at 9 am Hong Kong time, 9 am London time and 9 am New York time. These delivery times correspond to 9 pm (T + 0), 4 am (T + 1) and 9 am (T + 1) in New York and encompass around 20%, 45% and 85%, respectively, of the assets covered by regular daily flows dataset.
While the directional and sentiment signals provided by premium daily data are obvious, its value as a major, or stand alone, input for trading models remains unproven.
In this article we explore using the most complete early Equity Fund data, released at 9 am New York time, in order to trade at the T + 1 close in New York. This cuts the delay in knowing the flow data in half to just one day.
Playing the regional card
EPFR classifies each fund by its geographic mandate or focus, where the fund can invest, geographically. Many are country related, such as Germany or Singapore. Others are regionally focused — Latin America, EMEA or Asia ex-Japan – and some have a global focus. The latter include Global Emerging Market (GEM) and Global ex-US funds.
As a result of this clearly defined categorization, one can asset weight daily returns of relevant equity funds to isolate the return to each geographic focus. But can you predict them?
We tried predicting these regional returns using both early-release and regular data. For each trade date (T) and region, we pulled in the regional return for that date (time T), the 9 am New York early release flow from time T – 2 and the regular daily flow from time T – 3. For each region, the flow used – for both early-release and regular data – was the total flow into all funds assigned to that region divided by total starting assets of all the funds.
In order to make an apples-to-apples comparison, we looked only at those trade-date/region pairs where at least one fund appeared in the early-release data. Finally, since we were interested in relative returns to each region on the same trade date, we mean-adjusted the returns so that, for each trade date, the equal-weight average region return was zero.
We then ran regressions of regional return against T – 3 daily flow and T – 2 early-release flow across the entire data set. Our results appear in the table below.
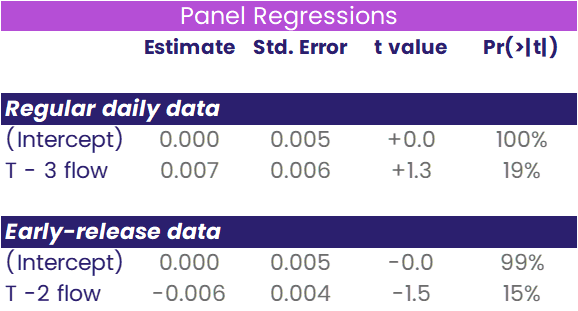
As you can see from our results, neither indicator proved predictive. In no case is our measure of predictive power, the t value (or t-statistic), anywhere near 2. The p-value in the fourth column says there’s, respectively, a 19% and 15% probability that a variable with no predictive power could have yielded a more extreme t-statistic by sheer chance.
One for all, and all for significance
It is an established maxim of military philosophy that concentrating your forces usually produces a better result. Taking a leaf out of this book, we tried to combine our two weak indicators into one, by regressing regional returns on the difference between T – 3 regular flow and T – 2 early-release flow.
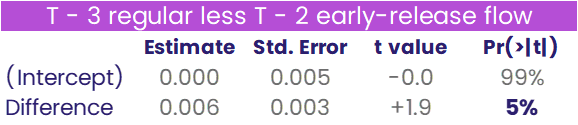
The results are now almost significant, there being only a 1 in 20 probability that such a high t-statistic could have been achieved by main chance.
Is there a better way to combine the two variables? To find out we regressed regional returns against both variable simultaneously.
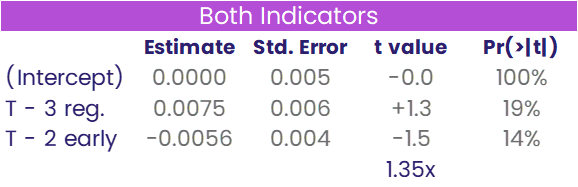
As you can see from the table, the two indicators want to be combined in a 4:3 proportion, based on the “Estimate” column.
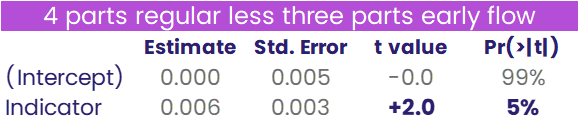
We build our final indicator by subtracting off triple T – 2 early-release flow from quadruple T – 3 regular flow. When we run the regression of regional returns against this one variable, we end up with a significant predictor with a t-value of 2.
Plenty of uplands to be explored
This foray into EPFR’s early-release data suggests that its value to investors is not limited to the indicative. But unlocking its predictive value will take more work.
Some of that work will focus on flows to fixed income fund groups which, in the interests of concision, we did not look at in this piece.
Did you find this useful? Get our EPFR Insights delivered to your inbox.


