Stock flows and
asset allocations dataset
Boost your view of 25,000+ individual stocks
EPFR’s Stock Flows and Allocations dataset has been designed with clients at its core.
Underpinned by our best-in-class data quality standards, we’ve gone above and beyond to provide a more intuitive user experience and better coverage for a smoother integration with your company’s internal processes.
The result is a dataset that enables access to over 25,000 individual securities, globally, and more than 60 different security types, offering more flexibility to help you reveal the investible truth.


Stock Flows: At a glance
- Coverage: 25,000+ individual securities ($13 trillion in AUM)
- Security types covered: 60+
- Data history dating back to 2010
- Data updates: daily (T+1), weekly (T+1) and monthly (T+26)
- Security-menu files published monthly
How we can help you
Buy-side: Bottom-up Systematic
Stock Flows and Allocations enable users to develop bespoke security-level signals based on fund positioning and flow information, which can then feed into their internal models and strategies.
By leveraging EPFR’s 30+ fund-level classifications, Systematic teams can construct signals that can be tested for Alpha-generating properties, reinforcing their search for orthogonality and additional value added within their existing signals/models.
Underlying metrics and fund-level flow information include:
- Value held
- Shares held
- % weights
- $ inflow and outflow
- AUM
Buy-side: Bottom-up Discretionary
Security-level factors provided by the Stock Flows and Allocations dataset, such as daily flow, monthly average positioning, and ownership dispersion metrics, can be used to complement your team’s fundamental and stock-picking process.
Empty
Your content goes here. Edit or remove this text inline or in the module Content settings. You can also style every aspect of this content in the module Design settings and even apply custom CSS to this text in the module Advanced settings.
Sell-side: Research
Integrating EPFR’s data with your research reports is easier than ever, helping Research teams benefit from EPFR’s stock-level positioning data.
Our best-in-class granularity gives Stock Flows and Allocations users the ability to use over a dozen filtering options, including ESG/non-ESG and active versus passive, for a deeper view of individual stocks.
“Stock Flows delivers a solution predicated on greater precision and accuracy”
Sayad Baronyan, CIO at EPFR
Coverage, flexibility, and accuracy
Stock Flows and Allocations provides a privileged window to more than 25,000 individual securities globally (from US and Emerging Markets to small-cap stocks). But there’s so much more than just that!
Users can now gain visibility of the number of shares held per each stock by ETFs and mutual funds. This new feature allows Quantitative teams to unlock additional data points and run faster and more accurate analyses in order to beat the market and generate Alpha. Deep diving into smart money effect, ownership concentration and other Quant-related factors is easier with Stock Flows.
On top of that, EPFR’s best-in-class granularity enables you to slice and dice the data using over a dozen filtering options for an unparalleled understanding of where money is moving. Filters include: investor type, fund domicile, theme, active/passive, and more.


Smoother integration with your datasets
The latest dataset iteration expands on the number of identifiers covered, therefore boosting the quality and robustness of our data by better capturing funds’ positions across stock exchanges globally. Examples of identifiers covered by EPFR’s Stock Flows and Allocations are: tickers, ISINs, and FIGI (Financial Instrument Global Identifier).
Since FIGI codes are never reused and remain allocated to the same share class in perpetuity, regardless of corporate actions, integration of EPFR’s dataset with your team’s processes is easier than ever, allowing users to run more complex analysis and data comparisons from the get-go.
EPFR fully oversees the processing of data before it is released to our clients, ensuring that you and your team will only receive data of the highest quality.
See Stock Flows in action
Take a look at these EPFR Insights to further discover how the Stock Flows dataset can support you.
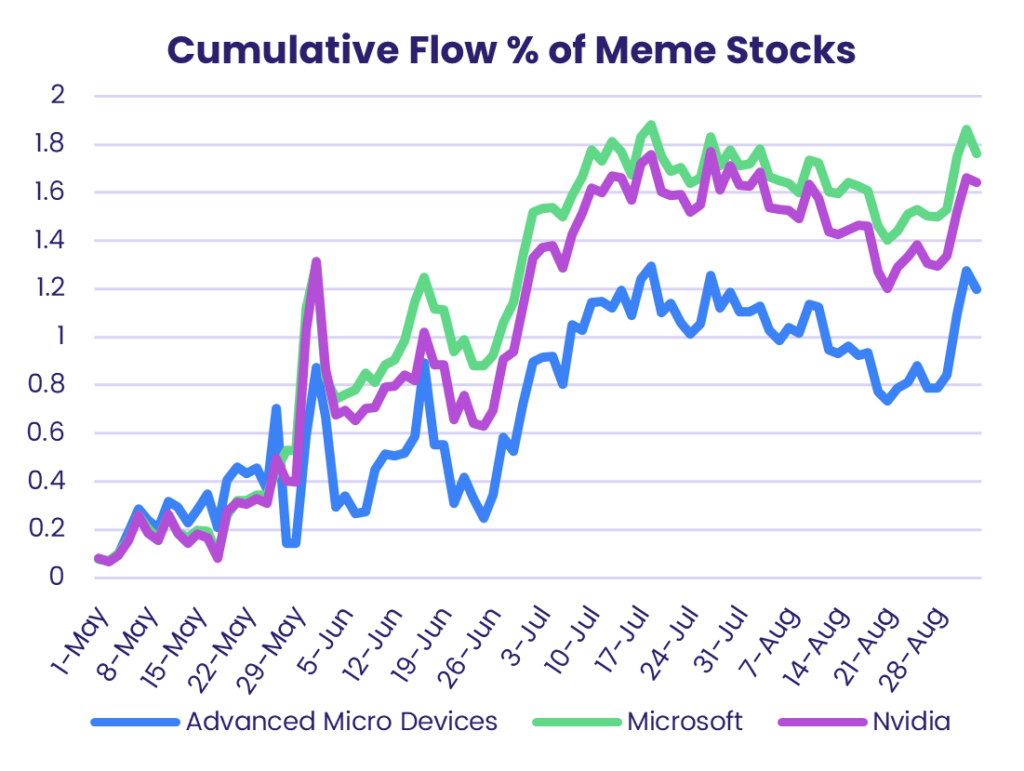

Off the wires: 7 meme stocks to buy before they soar to new heights in 2023
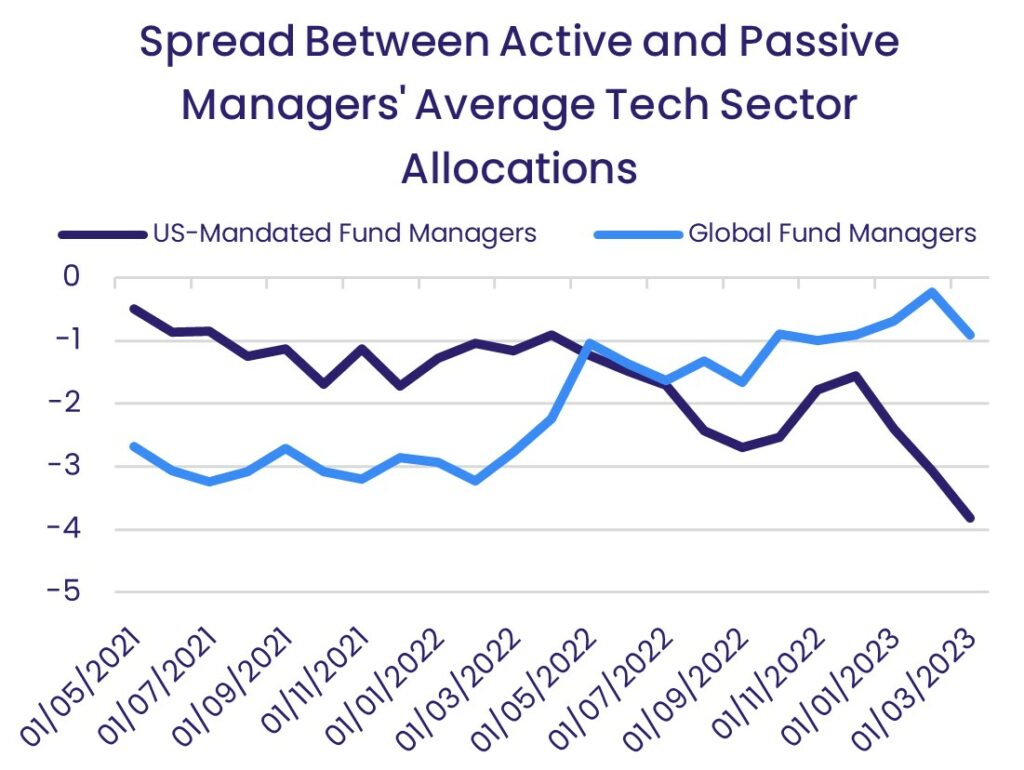
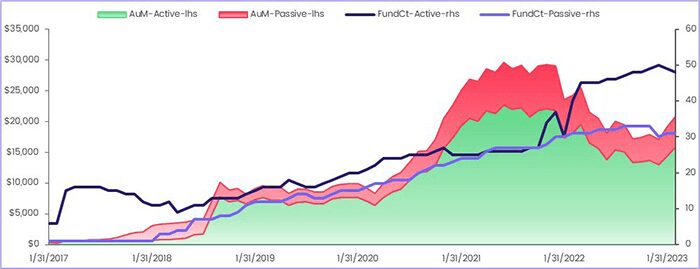
Off the wires: Investors bet on shrinking pool of tech stocks as rally narrows