Playing with dynamite
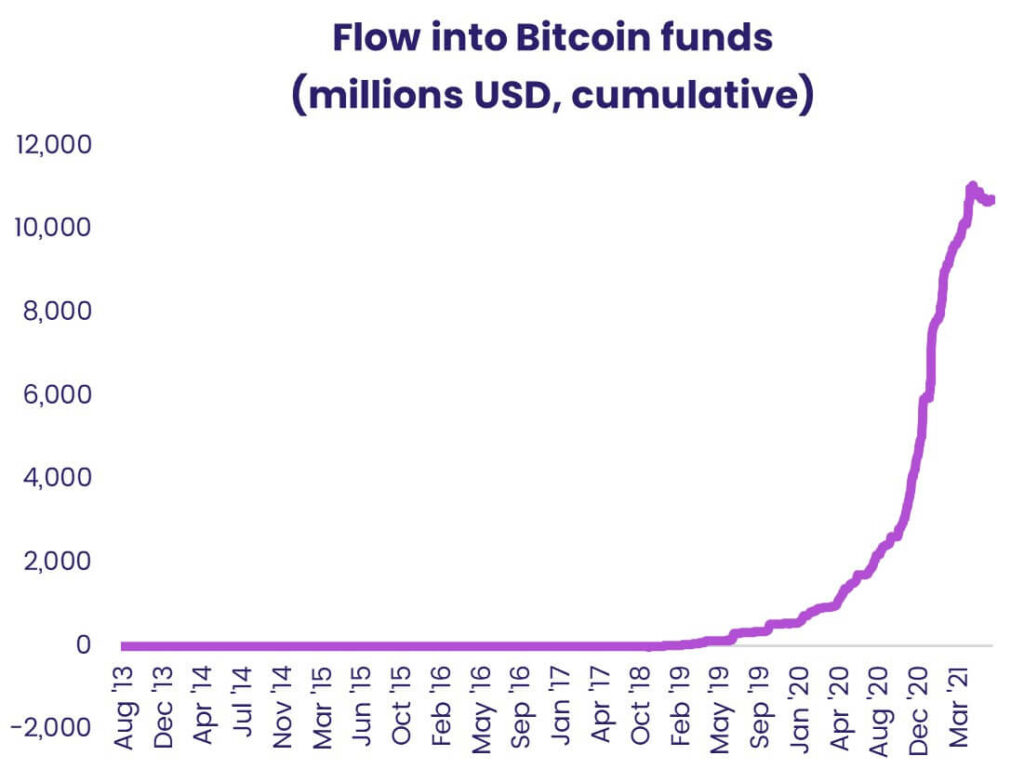
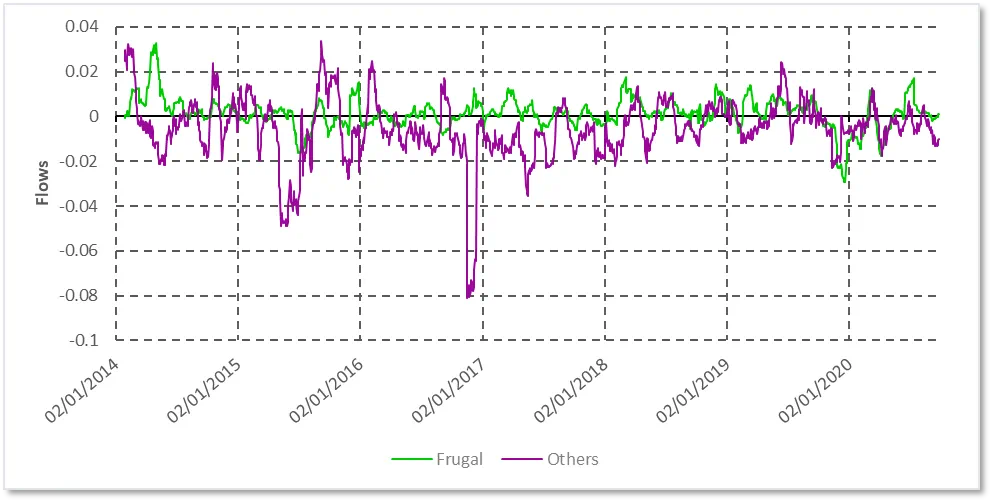
In this Quant’s Corner, we will look at the growing number of single-security Leveraged Funds in EPFR’s database and explore ways to generate...
Olivia Blaszkowski, Data Analyst at EPFR, works on both the quantitative research and client support sides of the business. She is knowledgeable about EPFR data sets and strategies; with this, she is constantly helping improve client experiences and is able to provide a variety of new content. This can include information and resources for clients, new research and discussions centered around uses for EPFR data.
Prior to becoming a Data Analyst, Olivia had one year of experience at EPFR as a Quantitative Analyst Co-Op while she was earning her bachelor's degree. During this time, Olivia built her knowledge of the industry and developed a thorough understanding of EPFR’s data by working on a variety of different projects.
Olivia received her B.S. in Applied Mathematics, with minors in Data Science, Computer Science, and Business from Wentworth Institute of Technology in May 2021.
Specialties: Fund Flows
USA 2+ years of Experience