On February 21st the closing price of the best-known cryptocurrency, Bitcoin, hit an eye-popping $57,128. On the same date in 2016 it was trading around the $400 level.
The sky-high prices, and the news that technology major Tesla had purchased $1.5 billion worth of Bitcoin and planned to accept it as payment gave a long-running debate about the cryptocurrency’s place in the financial landscape. Banks, regulators and businesses are revisiting key questions. Is Bitcoin a fad or part of the mainstream? Can I afford to ignore it?
The last question is one that EPFR has been asking itself. Having tracked the exponential take-off of environmental, social and governance (ESG) investing over the past five years, the trajectory of Bitcoin demand looks familiar. But has it reached the point where it influences the composition, valuation and correlations of the assets held by the universe of funds that EPFR tracks?
Nakamoto, we have lift off!
Bitcoin, launched in 2008 by a group that named itself Satoshi Nakamoto, is the most widely recognized cryptocurrency, a group of digital or virtual currencies that rely on encryption and blockchain technology to conduct and record transactions, preserve their value and prevent theft. Other cryptocurrencies include Ethereum, Stellar, Tether and Dogecoin.
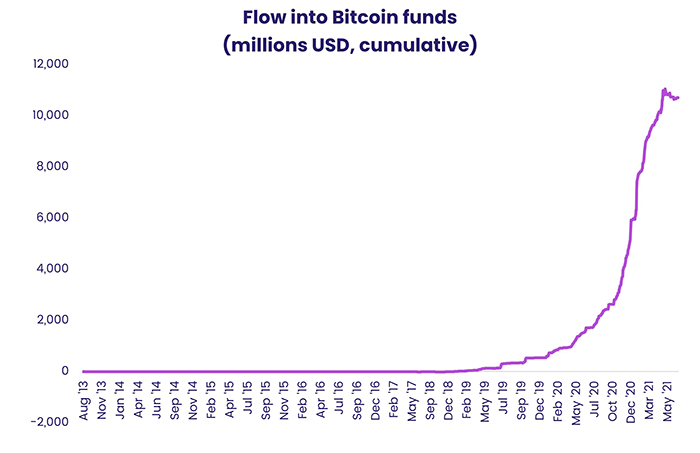
The past 18 months have seen a sharp increase in the number of mutual funds and ETFs with cryptocurrency mandates and an even sharper increase in net flows to these funds (see chart below).
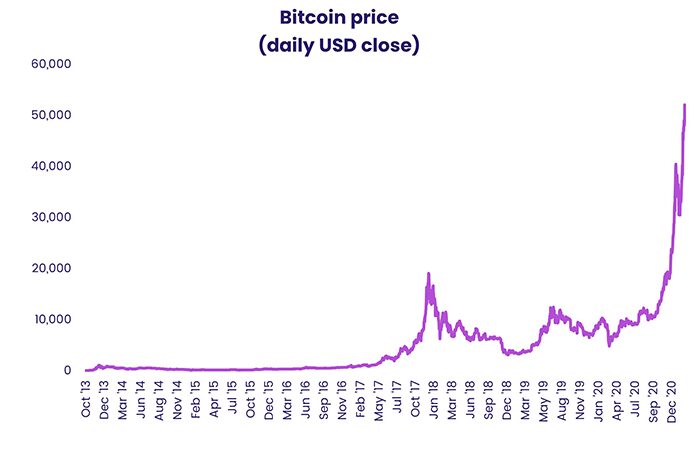
This trend is also reflected in the price, in established fiat currencies such as the US dollar, for cryptocurrencies. The chart below which shows the daily closing price for Bitcoin over the past seven-and-a-half years.
Inflows of this intensity into an established fund group, such as those dedicated to municipal and high yield debt, would have a measurable impact on EPFR’s momentum, rotation and crowding models.
Will this be the case for cryptocurrency funds?
An asset class of its own
To answer this question, we start by asking two more. What kind of asset is Bitcoin? And what is it related to?
To answer those, we looked at the ranked correlation of daily bitcoin prices against the returns of various asset classes. EPFR classifies equity funds by style box or, in the case of sector funds, by sector. Similar style classifications exist for Bond, Money Market, and Balanced funds. For each defined asset class, we computed daily asset-weighted average returns – in US$ — across all funds tracked by EPFR.
The table below shows the asset classes most closely related to Bitcoin (as measured by rank correlation across time).
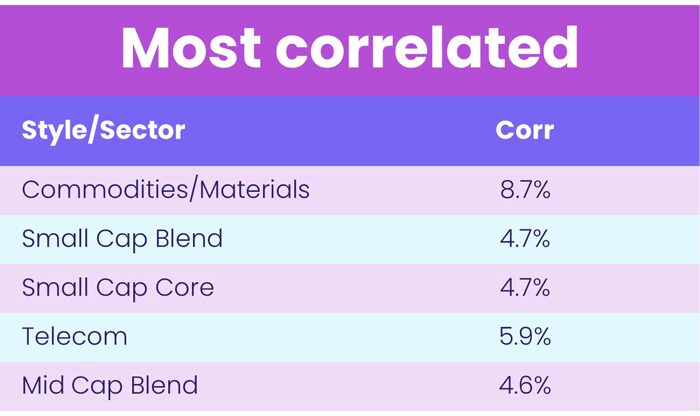
As you can see, the asset classes most closely related are (a)all equity funds and (b) even these correlations are not very high.
Giving PCA a try
Another way to uncover potential linkages involves breaking down daily returns by their principal components to best capture the spread of the returns data.
The forty-four EPFR Style/Sectors plus BitCoin makes 45 distinct assets. For each of these, we have 1,903 daily returns from 2nd October 2013 to 18th February 2021.
The first principal component is the return series associated with the riskiest portfolio of these forty-five assets having squared weights summing to one. This is the biggest risk factor.
Orthogonalize all the returns data to the first principal component. Repeat this process with these residual returns to extract the second principal component, the biggest risk factor orthogonal to the first principal component. Proceeding in this manner yields a total of forty-five principal components.
Now, we can turn everything on its head and express the forty-five assets as portfolios of these principal components. The first two principal components capture the bulk of the risk associated with these forty-five assets. In effect these two have proven to be the biggest two risk factors over the period under study. The weights of each of the forty-five assets on the first two principal components can be thought of as risk factor loadings.
The chart below plots, for each of the forty-five asset classes, the loading on the second principal component against the first.
This allows us to determine Bitcoin’s relation to the other asset classes. As it turns out, Bitcoin is in a very real sense marching to the beat of its own drum.
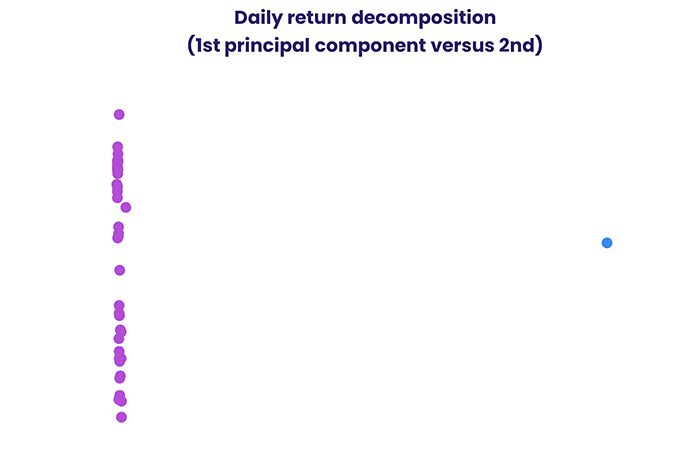
As the graph above illustrates, all the historic asset classes (shown in purple) are clustered together, and this clustering shows that these asset classes respond in sufficiently similar manners to market forces. However, Bitcoin (in green) sits alone at some distance from this cluster. This means that Bitcoin is a risk factor unto itself.
Prediction is fruitless
Unsurprisingly, predicting the direction of Bitcoin using flows and returns turns out to be an ineffective approach. The findings from comparing Bitcoin daily returns against the returns of various asset classes suggests that there is a very weak relationship between any two events. Therefore, no significant correlation between Bitcoin returns and returns from any asset class could be established.
Seeing as there is no direct correlation at present time, more investigation was done to see if premature or delayed relationships were possible. Unfortunately, the results from using a span of T-10 to T+10 day lags in Bitcoin returns showed no improvement in the correlation to any style or sector (looking at both returns and flows). Thus, once again, the results indicate that there no significant relationship between Bitcoin and any asset class.
It seems likely that quantitative analysis of fund flows will have to factor in cryptocurrencies at some point. But that point, for the moment, is clearly an outlier.
Did you find this useful? Get our EPFR Insights delivered to your inbox.


