Historically, it has been hard to extract signals from aggregated hedge fund data that can (a) be integrated into existing investment processes or (b) used as the foundation for a new process. A desire to protect proprietary information, and greater discretion compared to so-called 40 Act funds regarding how much and when to report, makes the flow of data from the hedge fund universe inconsistent and heterogeneous.
A number of companies do collect and distribute hedge fund performance data. EPFR recently partnered with one of these, BarclayHedge, which has established a reputation over the past 30 years as a credible source of performance information.
This partnership allows EPFR to apply its screening, categorization and quality control processes to the flow data collected by BarclayHedge. This normalized data now encompasses over 3,300 funds managing $1.5 trillion, representing a share just over 41% of the hedge fund universe (see chart below).
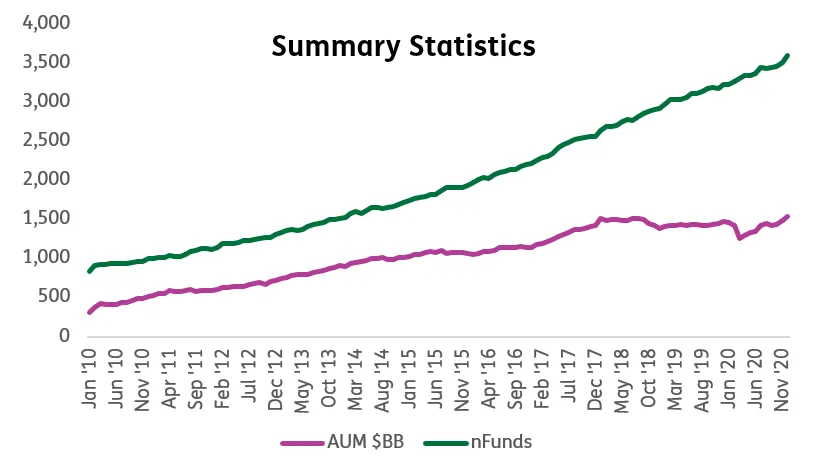
As a result, EPFR now provides clients a Hedge Fund Flow Product that has sufficient coverage for a quantitative deep dive.
Back to the future
Where to dive into this expanded pool of data? EPFR has started by applying the proven methodology outlined in the 2018 paper Fund Flows as Country Allocator by Srimurthy, V. K., Shen, S., & Smalbach, M.
This approach is based on calculating a one-month flow, expressed as a percentage of assets, that is aggregated up to the country of domicile. The new database makes this possible because it includes fund characteristics such as domicile, investment strategy, geographic mandate and fund currency.
However, another aspect of the new database – its frequency – requires an adaptation of the methodology. The data has a monthly frequency, and it takes a month to collect and organize the data before it is published on the first weekday after the 6th NYSE working day. For that reason, for the purposes of our model we lag the data by two months.
Although, Srimurthy et. al. (2018) proved that flows, aggregated over a short window close to the present, work as a momentum indicator, practical experience shows this no longer holds when the flows are two months old. Accordingly, for the purposes of this predictor we reversed the one-month-flow factor by changing its sign.
Ten out of eleven for a first effort
By converting the one-month-flow factor from positive to negative, we now have, for each country on a monthly basis, a flow-reversal number.
For our first pass, we decided to utilize the factors to predict forward returns to equity markets at the country level. We sorted MSCI ACWI countries into five buckets using this factor, with the low and high flow buckets being labelled quintiles one and five respectively. Each equal-weight quintile portfolio was held for one, three, six and twelve months.
We report average annualized returns to these quintile portfolios in the table below. Quintile-portfolio returns are expressed as excess returns over those of the portfolio holding MSCI ACWI countries in equal proportion.

As the table above illustrates, the flow-reversal effect is strongest one month out, then weakens subsequently.
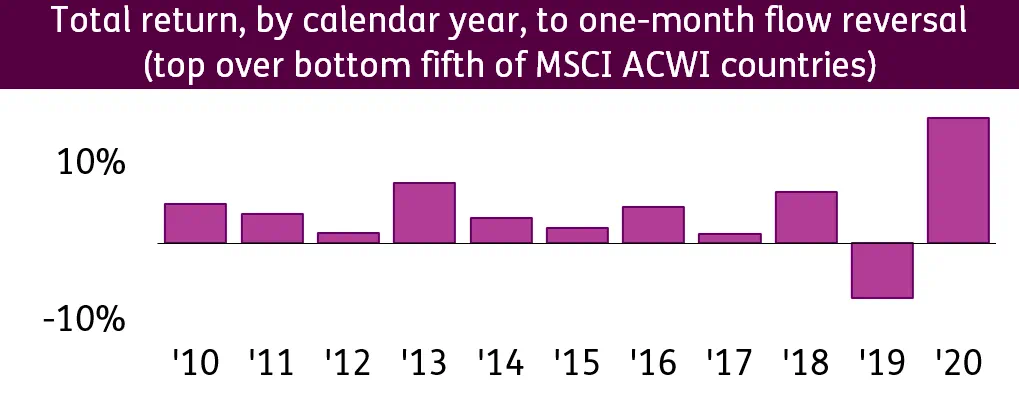
The one-month forward Sharpe ratio — the annualized average return to the top quintile, less the bottom, scaled by the annualized average standard deviation of the same return series –is reasonable at 0.48. When we look at calendar-year performance, we find corroboration (see chart below).
Where next?
This predictor added value 90% of the time over the past decade. Only in 2019, perceived by many to be the end stage of an aging recovery, did it fail.
Exploring why this predictor stumbled in the year preceding the current pandemic, digging into the comparative opportunities afforded by running this dataset alongside the $46 trillion worth of mutual fund and ETF assets tracked by EPFR and developing new factors are three of the areas calling for additional dives.
Did you find this useful? Get our EPFR Insights delivered to your inbox.

