Cheerleaders for the UK’s stock market are thin on the ground these days. They are even thinner when it comes to the small and mid-cap spaces, with some forecasters arguing that key indexes will be hollowed out by constituent defections and ‘lift outs’ to such an extent that by 2030 they will no longer be viable.
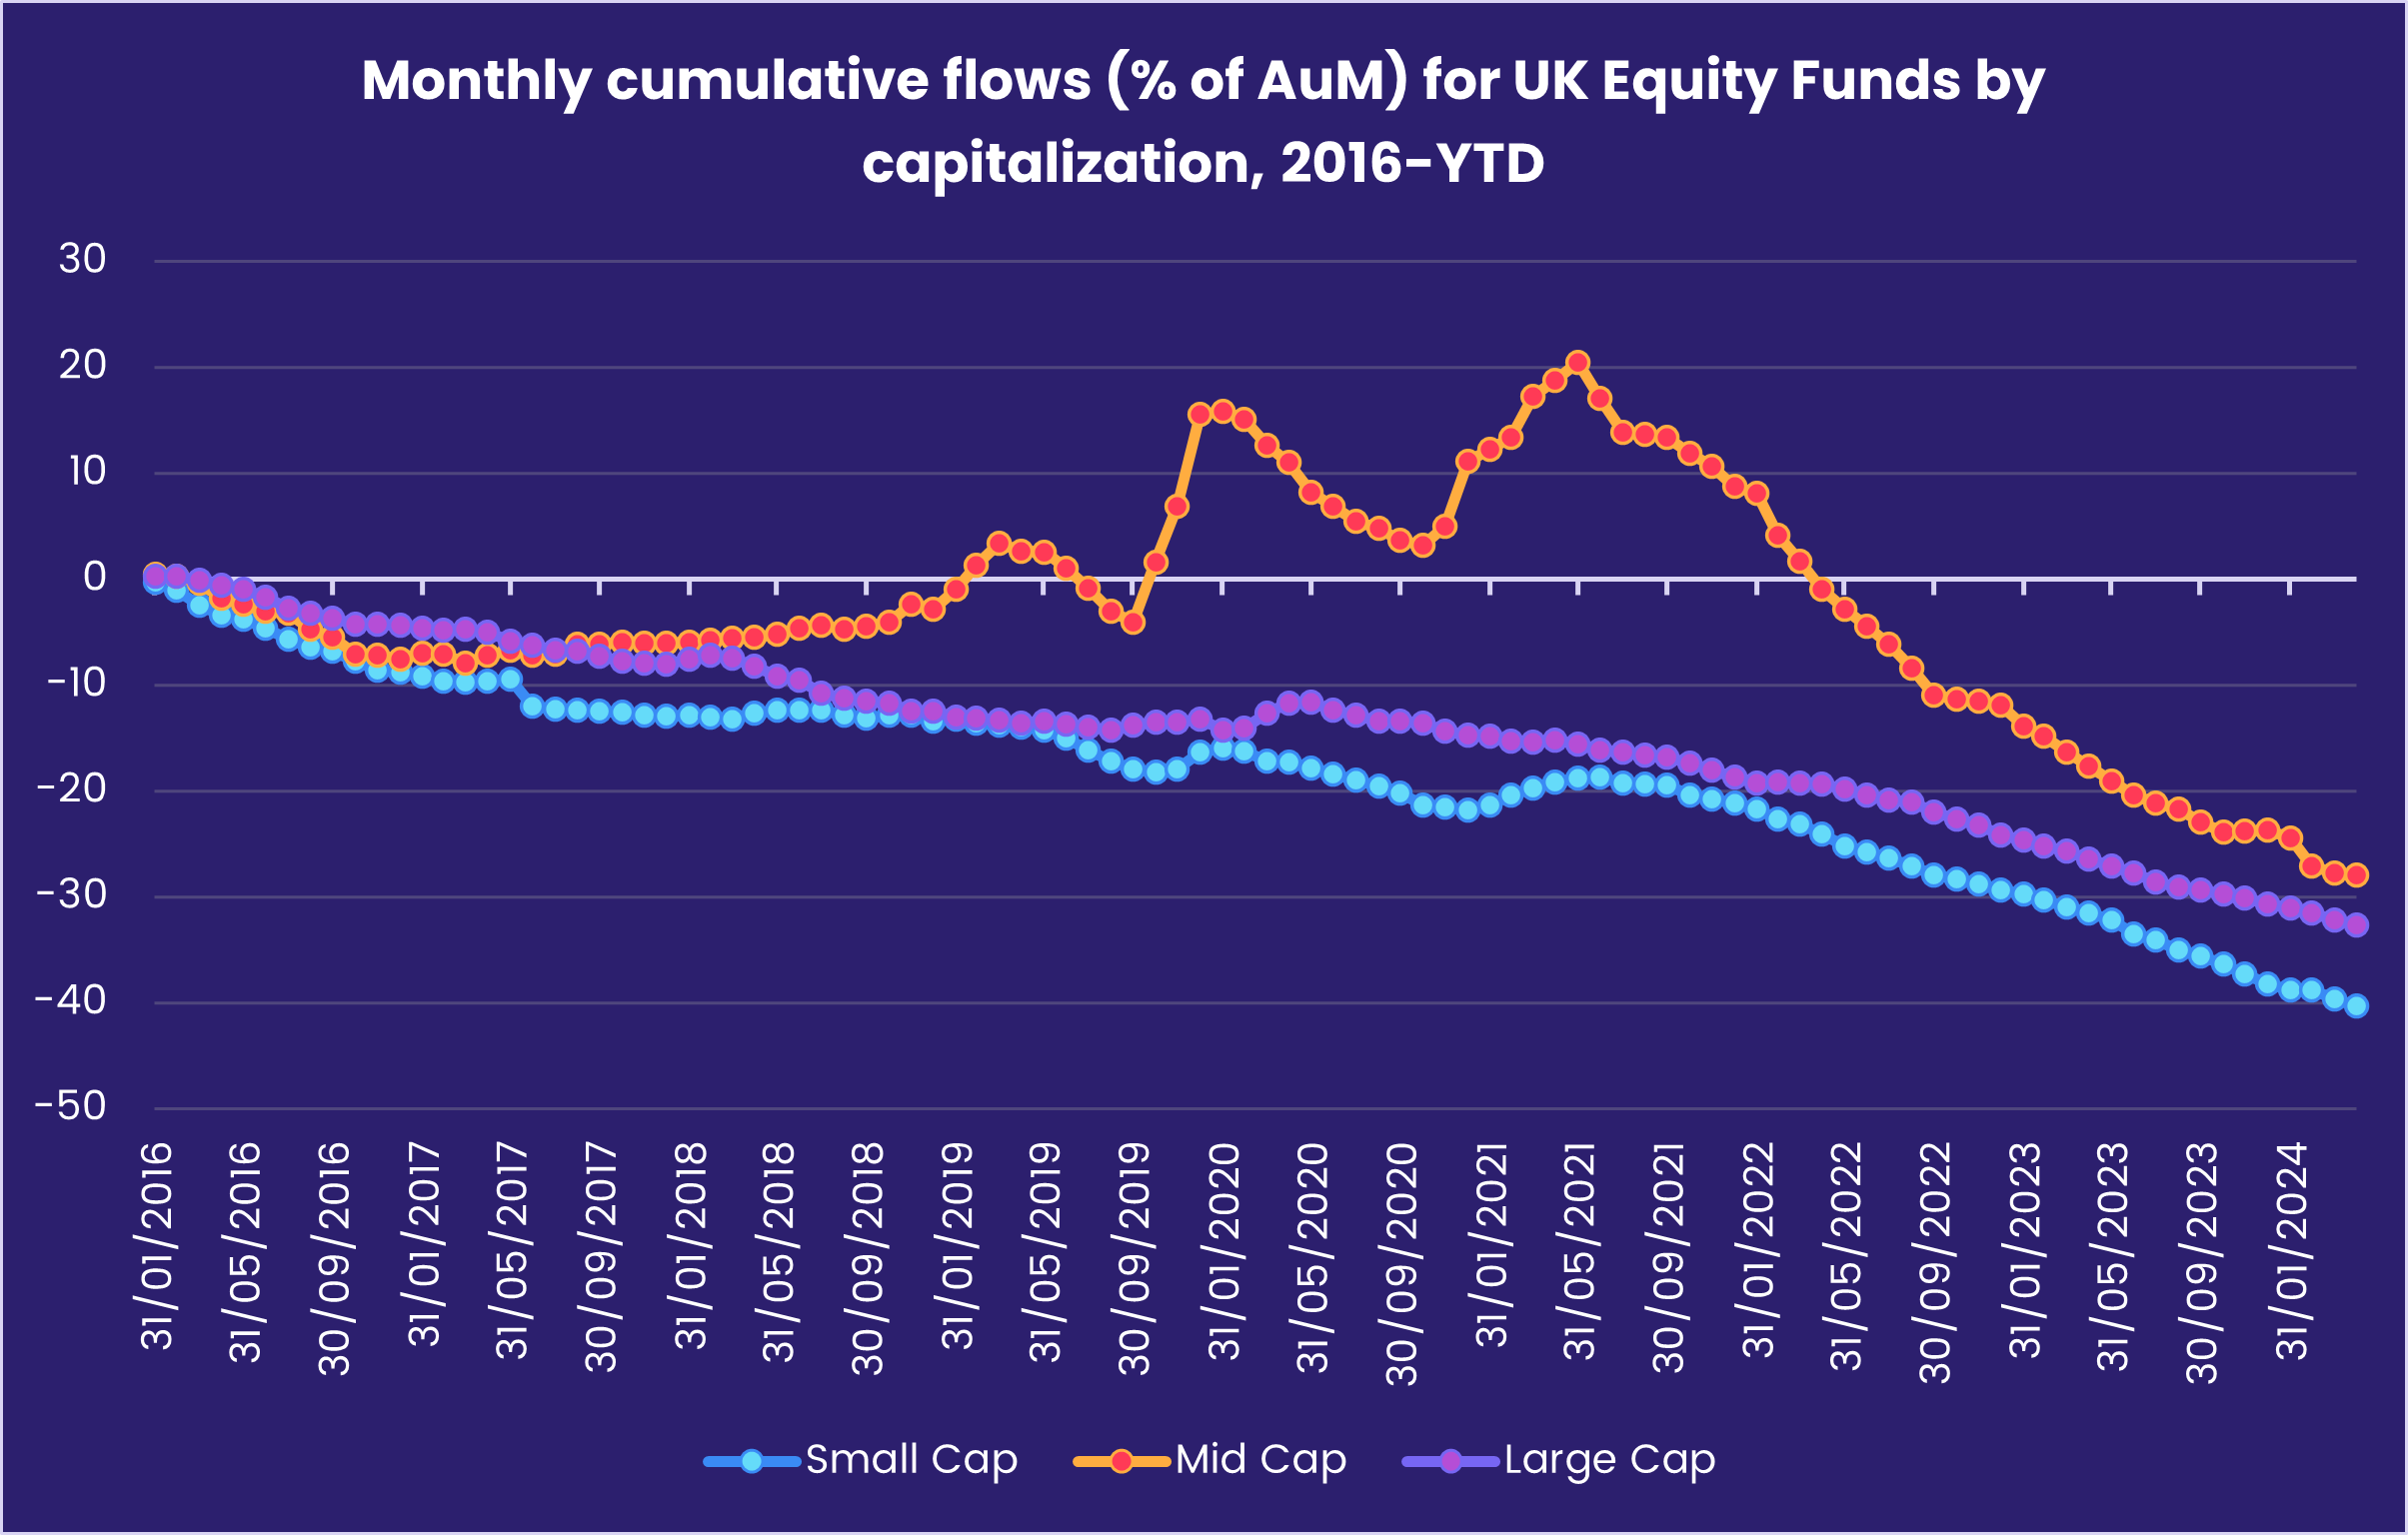
One of the indexes viewed as ‘at-risk’ is the FTSE-250, the home to domestically focused UK mid-cap plays such as Tate and Lyle, Harbour Energy and WH Smith. The index was up some 4% in 2023, versus a gain for the largest companies of 24% per America’s S&P 500, and was hit by the general exodus of UK-listed companies. That exodus was mirrored in the flows to EPFR-tracked UK Equity Funds, with investors accelerating their post-Brexit pullback.
British companies leaving the UK stock market usually followed one of two paths: a new overseas listing, generally in the US, or a private equity “lift out” (or the targeted acquisition of teams from another firm). Those “lift outs” came with a premium. Furthermore, with the UK’s economy beginning to recover and the Bank of England signaling it will not wait for the US Federal Reserve before starting to cut interest rates, the case that British mid-cap stocks offer value gets stronger.
In this Quants Corner, we will see what excess value EPFR’s factor-based analysis can unlock.
Going to the Stock Flows well
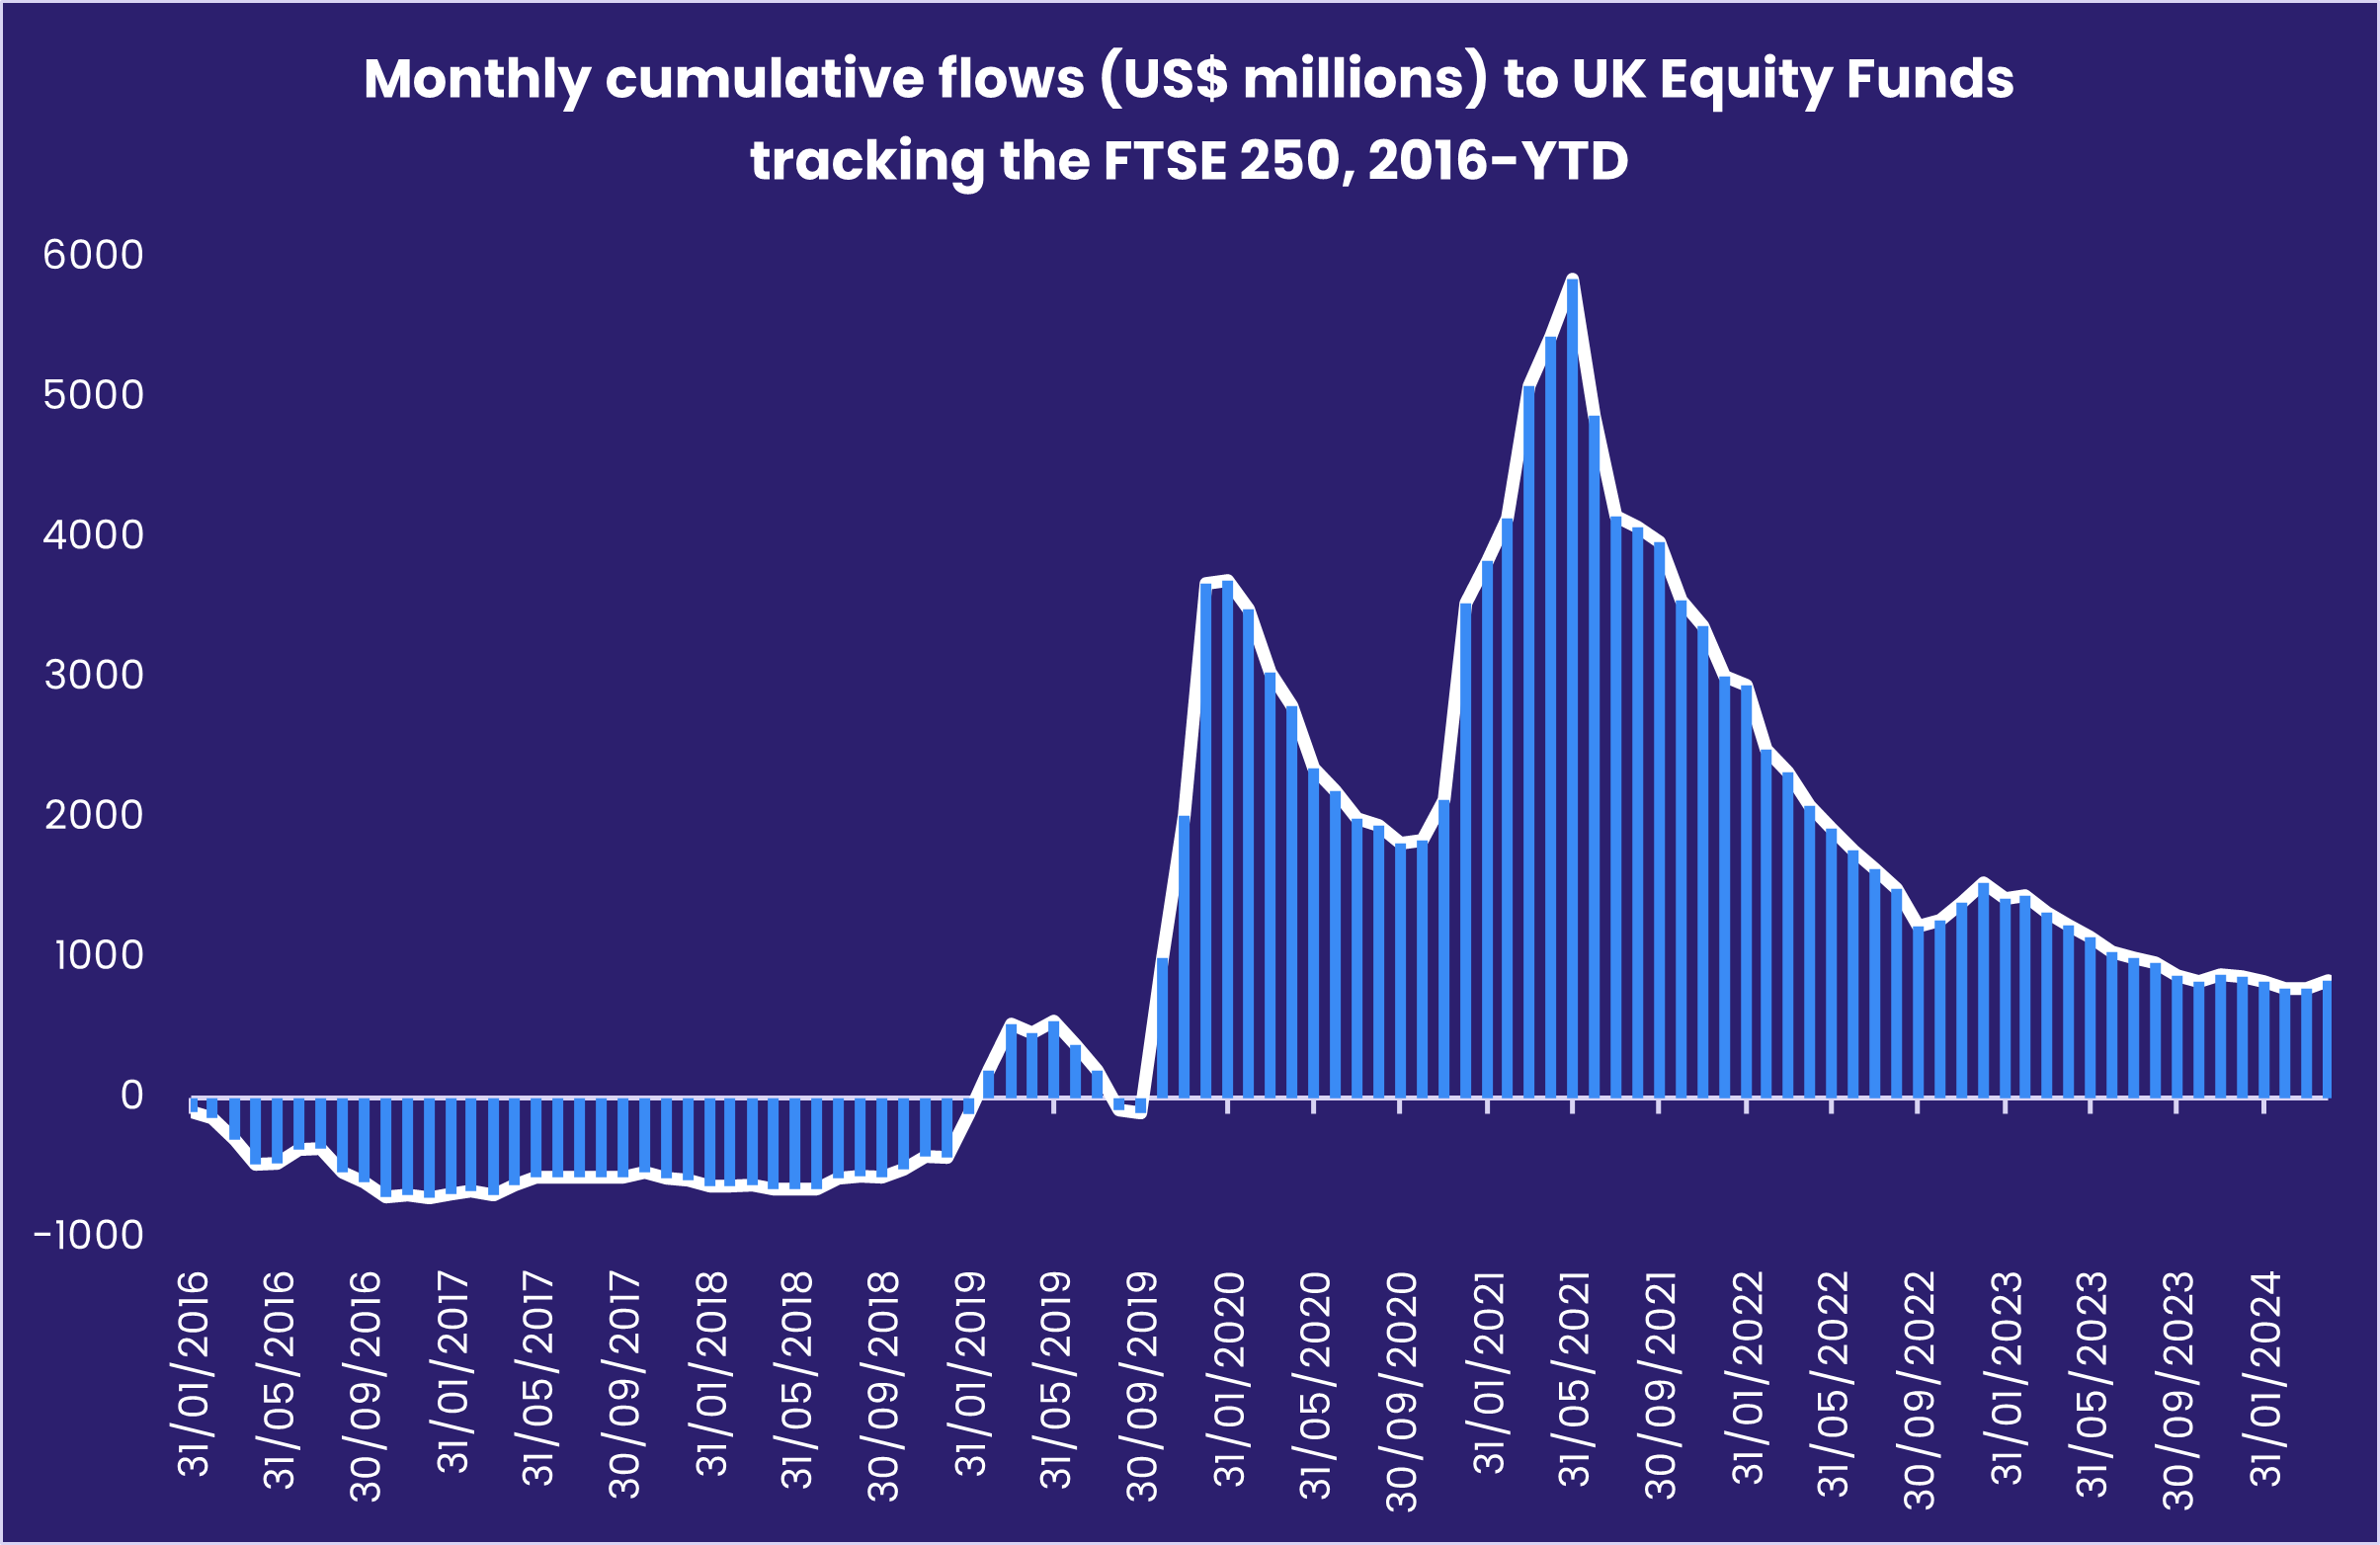
EPFR’s various datasets afford users a number of views into appetite for, and sentiment towards, the stocks that make up the FTSE-250 Index. Looking at aggregated flows for all funds tracking this index, enthusiasm for these funds soared in the wake of the Covid-19 outbreak before rolling over in early 3Q21.
For the purposes of this analysis, however, we turn to the Stock Flows database which tracks the buying and selling by EPFR-tracked Equity Funds of a universe of 25,000 US and foreign stocks. Among those stocks are the ones that make up the FTSE-250 Index.
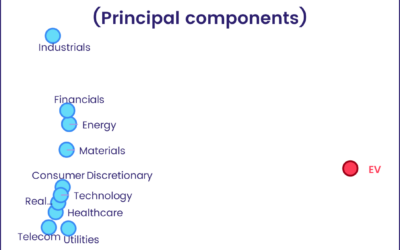
With these in hand, we apply the full suite of factors generated internally by EPFR’s Quant Team and apply them to the stocks in the FTSE-250 Index. The stocks are then bucketed into quintiles according to their factor ‘score’.
Among the factors are ones that look at raw flow momentum, capture trends in active manager buying and allocating, look at ownership dispersal and concentration and capture the skew in manager allocations. In the interests of space, we list below the equations for only the three most effective factors. These are the two ownership dispersion factors:
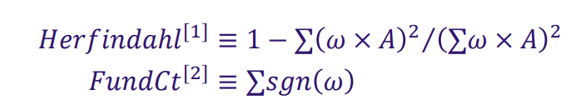
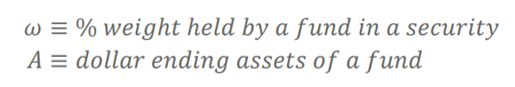
Where:
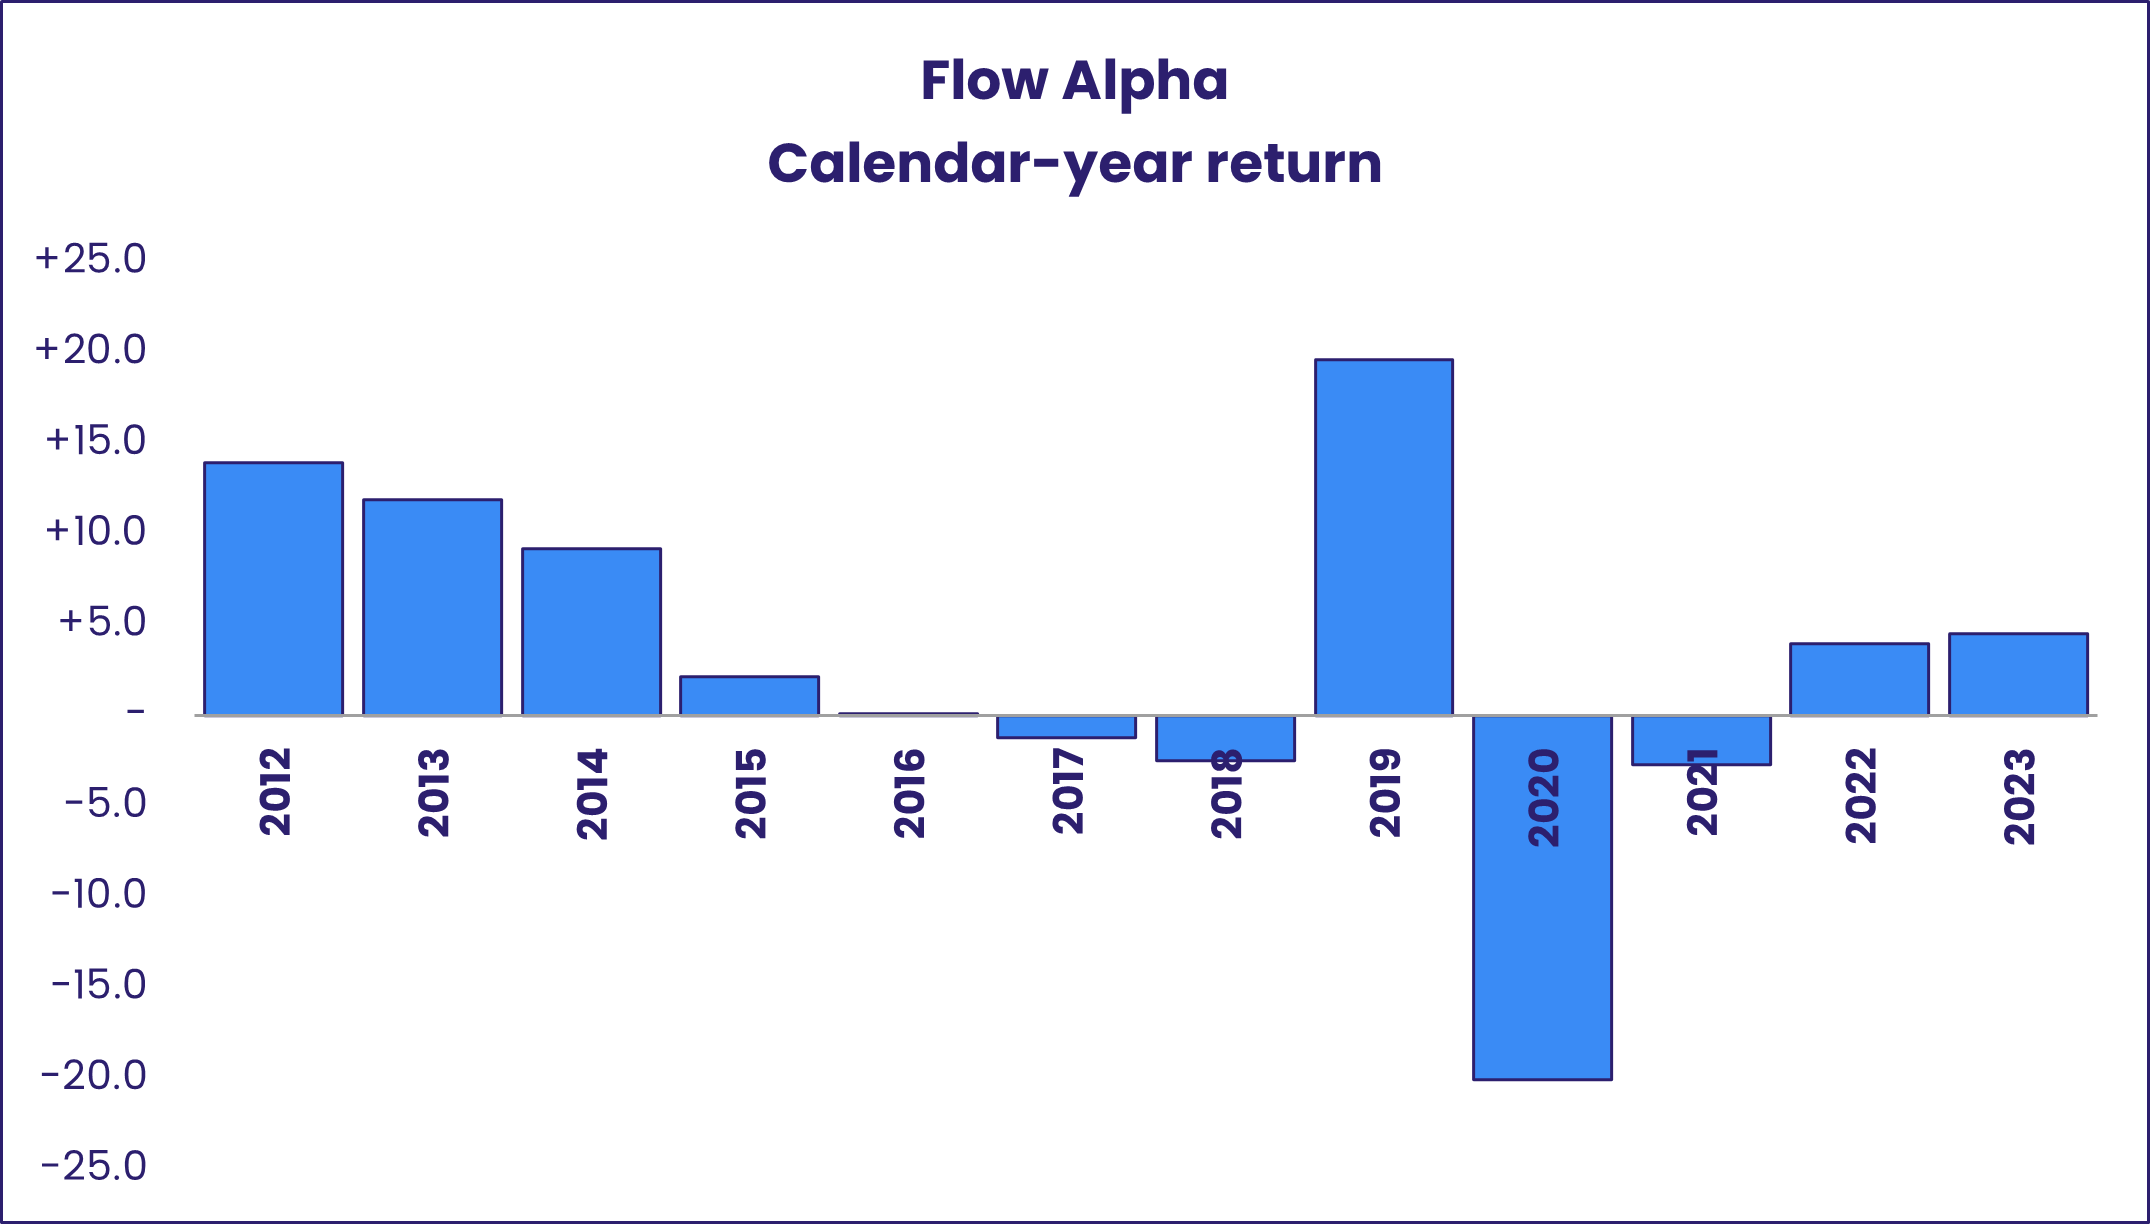
And a stand-alone factor, Flow Alpha, that utilizes some of EPFR’s existing factors:
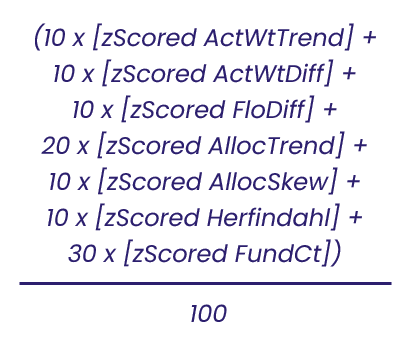
Where the zScore is derived by subtracting off the mean and dividing by the standard deviation.
Could be good while it lasts well
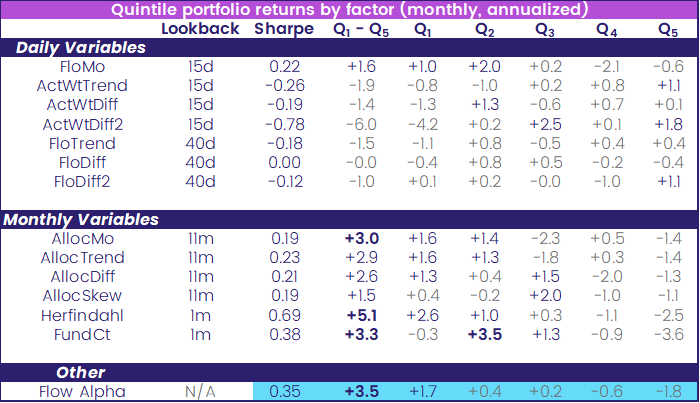
Having established our quintiles for each factor, we then apply a simple strategy based on going long the top quintile and short the bottom quintile. The back-test results are tabulated below. All results are sector neutral.
As you can see from the table on the next page, monthly factors – especially those focused on ownership dispersion – produce the best results.
When we look at quintile spread for Flow Alpha on an annualized basis for the FTSE-250 constituents, it shows excess returns rebounding from the low of the first pandemic year (2020).
If the naysayers are right that British indexes will stagger into the next decade on their last legs, this trend may not last too long. But our analysis shows again why it pays to dig deeper into broadly negative narratives. Using EPFR data and factors, there are certainly seams of silver to be mined amidst the coal.
EPFR’s Fund Flows data unlocks the ability to view flows dedicated to a specific region, and by capitalization, giving insight on directions of sentiment for some of the largest versus smallest companies. With a more granular approach, we showed how this database also captures views of aggregate flows for all funds benchmarked to a specific index (or indices). The real exploration was in applying the full suite of factors produced by EPFR’s Quantitative Research Team across all stocks that track a specific index. This allows us to long and short the top and bottom quintiles, respectively, which have been bucketed based on their ‘factor score’. Finally, quintile spreads for Flow Alpha provide insight into returns. While we decided to dive into the ‘at-risk’ FTSE-250 which tracks major UK mid-cap companies, this analysis could be performed on any index, and in any region.
Did you find this useful? Get our EPFR Insights delivered to your inbox.