With less than a week to go before America chooses a president, what are the flow and return numbers saying? The flows and returns for EPFR-tracked funds, that is.
Will incumbent Donald J Trump be re-elected? Or Joe Biden voted into office as the 46th President of the United States?
Quantitative analysis of fund flows and returns allows us to craft a new factor, which we are calling the Trump Sensitivity Factor, that unlocks political and future performance signals from the data.
Trump, Biden or somewhere in between?
We use the Trump Sensitivity factor to score funds. But first we need to create it.
This factor depends on the weekly return of each fund — which EPFR collects — and Trump’s approval rating. We use the Real Clear Politics Trump Job Approval Poll Average as a proxy for Trump’s approval. This is easily accessible via Bloomberg (RCPPTAPP Index).
With these elements in hand, we regress each equity fund’s return versus that of the S&P 500 and the week-over-week change in Trump’s approval rating for the 52 weeks ending October 14. The Trump sensitivity score for each equity fund is the coefficient, from the regression, of the weekly change in Trump’s approval.
We then proceed to rank each equity fund into three buckets based on Trump sensitivity, so that each bucket has an equal number of funds. The third of funds with the highest Trump sensitivity are called “Trump” funds. That is because, controlling for the return of the S&P500, our proxy for “the market”, these funds tend to appreciate in tandem with Trump’s approval.
The bottom third of funds, ranked by their Trump sensitivity score, are labelled “Biden” funds, whereas the remainder are classified as “Neutral”.
Taking the factor global
EPFR classifies funds based on where, geographically, they have a mandate to invest. For each geographic focus, we sum up the assets under management of Trump, Neutral and Biden funds. Each group is assigned a Trump-sensitivity score which equals the ratio of the AUM difference between Trump and Biden funds and the total AUM of the entire group.
The table below shows the 10 most Trump-sensitive groups by geofocus. Assets under management are in bold whenever they represent more than 50% of the group’s AUM. They are in light grey whenever they represent less than 10%. The Trump sensitivity of the group is in light green whenever it is positive, or dark green otherwise.
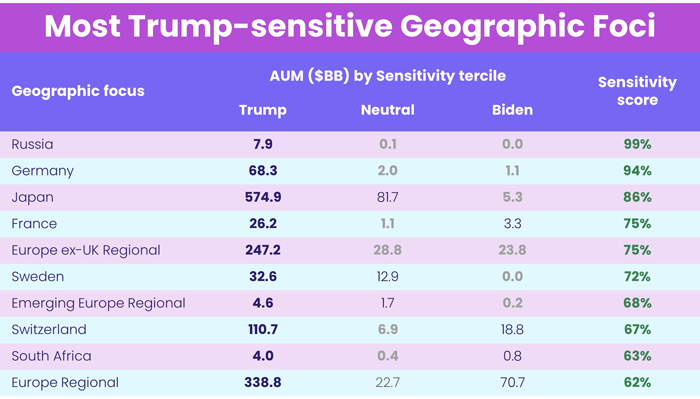
Amusingly, Russia funds are the most Trump sensitive, but for the most part, Europe dominates this list.
Now we look at the other side of the coin.
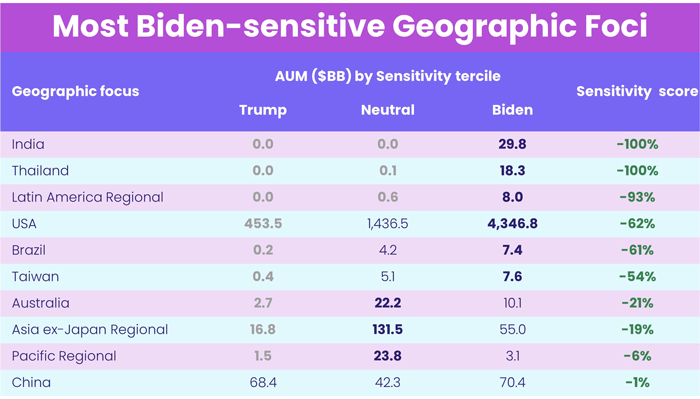
Interestingly, US funds are on this list, suggesting they do worse whenever Trump’s approval inches up. India funds are the most Biden sensitive outpacing even China, the target of the President’s ire.
Seeing value in the challenger
EPFR also classifies – or sub-classifies — funds by asset class, capitalization, style or sectors. Historically, US fund groups with style or sector mandates have proved particularly sensitive to expectations ahead of US presidential elections.
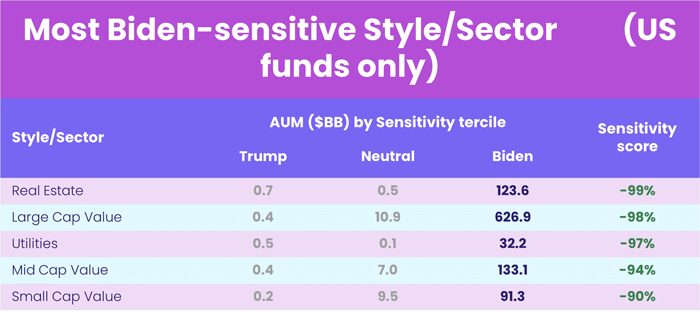
As was done when we use geographic focus as the organizing principle, each style/sector grouping is assigned a Trump-sensitivity score, computed in precisely the same manner. The tables below show the assets under management of the five most and five least Trump-sensitive groups broken down into Trump/Neutral/Biden buckets.
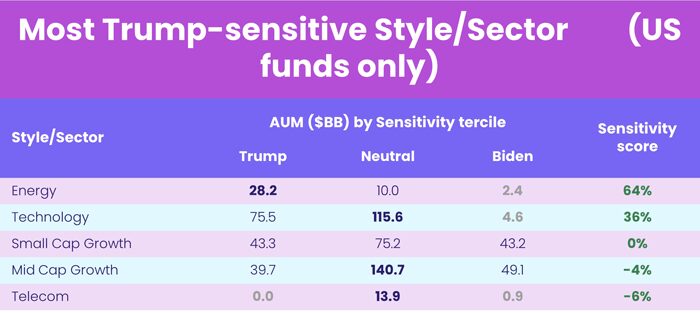
Not surprisingly, given this administration’s relative lack of concern for the environment, energy is most Trump-sensitive.
Real estate is the most Biden sensitive, probably because that sector needs an end to the pandemic more than most, and in keeping with Biden’s emphasis on Main Street over Wall Street he scores better with funds managed for value.
The methodology can also be applied to global funds with sector or style mandates.
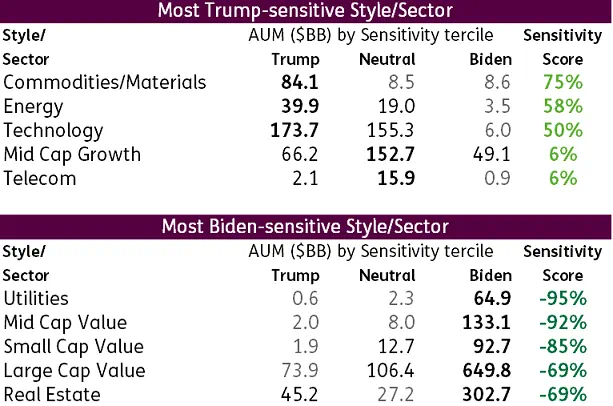
As was the case with US funds, Energy and Technology Sector Funds are Trump-sensitive whereas Real Estate and Large Cap Value Funds swing towards Biden.
Flowing red, returning blue
Now that we have identified which fund groups are most closely correlated with the fortunes of the respective candidates, what are the flows and returns saying about those fortunes?
The chart below shows collective net flows, expressed as a percentage of assets under management, into Trump/Neutral/Biden funds over the past eight weeks.
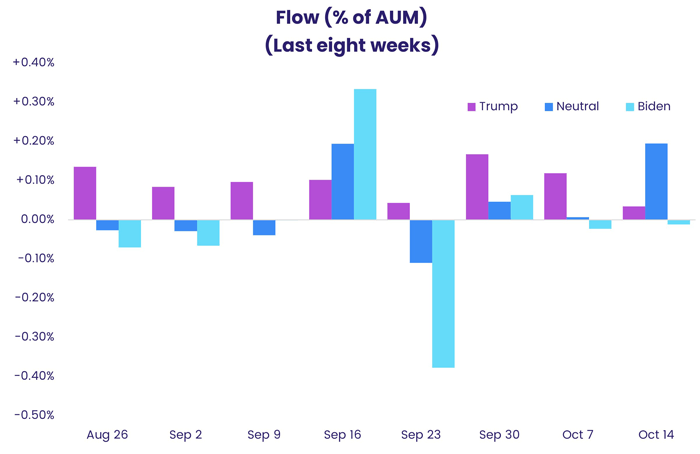
From this perspective, the week ending September 23 was very bad for Biden. Since then the gap between Biden and Trump fund flows has narrowed but remained tilted in favor of funds with Trump or neutral ratings.
Applying the same methodology to fund returns, we chart asset-weighted returns to Trump/Neutral/Biden funds below.
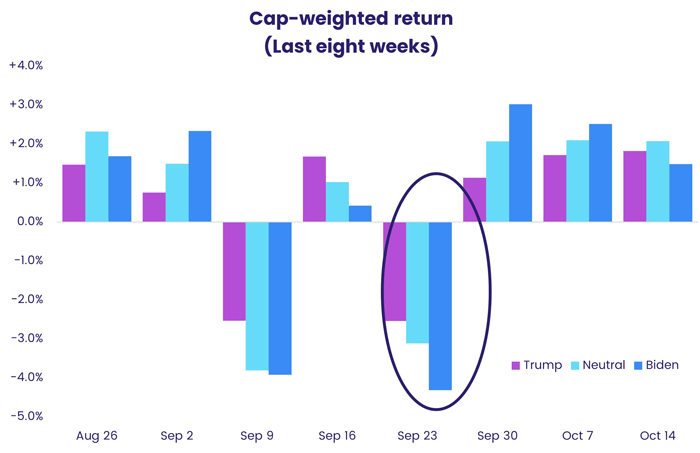
Again, the week ending Sept. 23 was also very bad for Biden from a fund-return perspective. Thereafter, however, the returns to Biden funds have outpaced those of Trump funds.
Conclusion
Our analysis in this blog provides clear investment signals by geography, style and sector for investors who have a strong conviction about which man will win on Nov. 3.
In terms of identifying the winner, returns – which reflect broader market sentiment – point to a Biden victory. But investors who express their views through mutual funds are still committing more money to groups that fare better under the incumbent.
Did you find this useful? Get our EPFR Insights delivered to your inbox.

