Corporations and governments around the world have been visiting capital markets with growing regularity since the 2008-09 financial crisis, and the Covid-19 pandemic has reinforced this trend. OECD sovereign issuers tapped markets for $11 trillion during the first five months of 2020 and forecasts for full-year US corporate issuance are around the $2 trillion mark.
So far, demand has matched supply. This is largely thanks to yield hunger, a rotation away from equity by retiring baby boomers, and the support – both implicit and explicit – of major central banks. But the flood of issuance, allied to the financially repressive policies being pursued by the US Federal Reserve, Bank of Japan, European Central Bank and other major central banks, has muffled many of the classic signals that fixed income investors used to chart a profitable path.
In the spirit of making lemonade from lemons, quantitative analysis of these elevated deal flows provides some actionable insights into key bond markets. In this blog, we will explore how these signals can be unlocked and applied to one major market.
Narrowing the focus
In a year of extraordinary global bond issuance, Europe has been something of a hot spot. According to Informa Global Markets (IGM), their Deals Database shows total year-to-date bond issuance hit €2.36 trillion through the end of October. This is higher than any 12-month period in the past five years. (Figure-1)
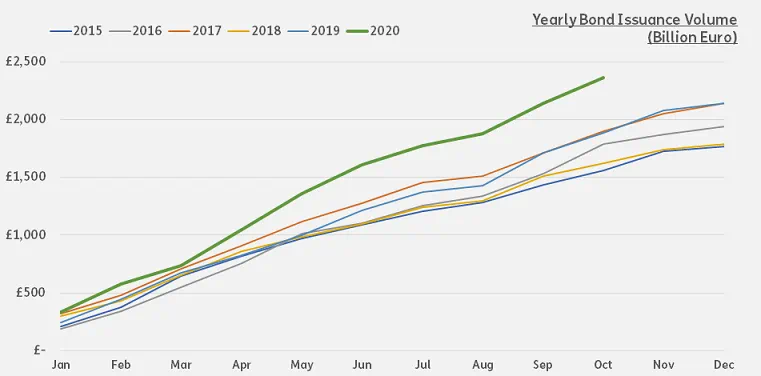
Figure-1 Yearly Bond Issuance Volume in Europe
The bulk of this year’s issuance came from sovereign borrowers looking to maintain or boost spending amidst a pandemic the decimated tax revenue. According to IGM data, €1.16 trillion of sovereign debt has been issued YTD – 54% higher than the full year total for 2019.
On the corporate side, a rising tide of pandemic-related non-performing loans, and fresh rounds of financial repression that are squeezing loan margins, has dulled investor appetite for debt issued by financial companies (mainly banks). Non-financials, on the other hand, have issued €736 billion worth of debt YTD. This is close to total debt issuance during 2019. (Figure-2)
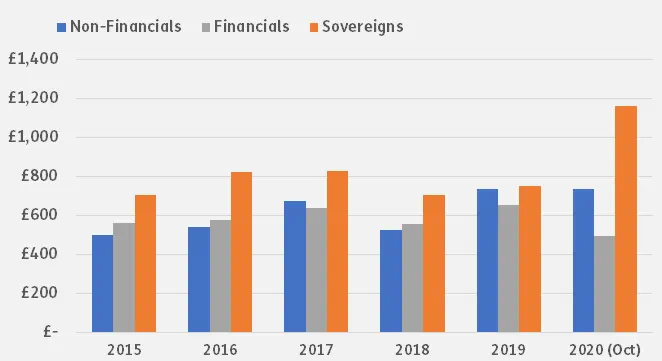
Figure-2 Yearly Bond Volume in Europe by Issuer
Among the non-financials, the biggest increase in issuance was seen in the manufacturing space. Their €186 billion total YTD exceeds that for any of the past five years. Issuance by European mining plays is also at a five-year high. (Figure-3)
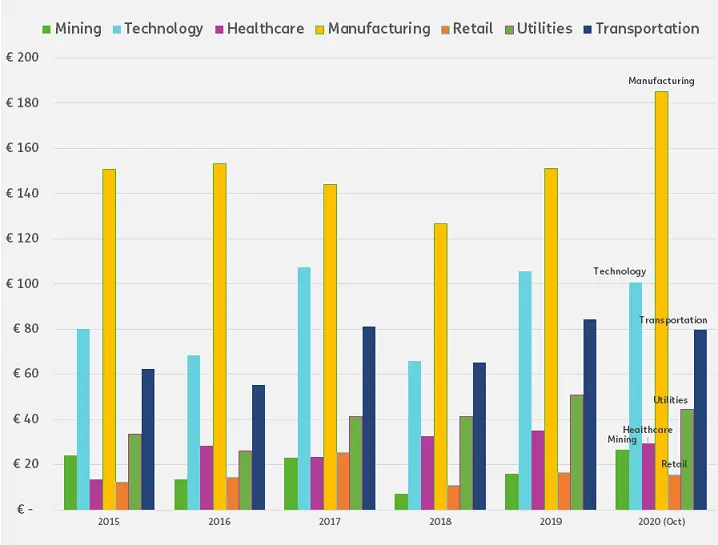
Figure-3 Yearly Bond Issuance Volume in Europe by Issuer Industry
In terms of credit quality, buyers are showing a clear preference for investment grade paper. While the issuance of high yield debt so far this year is below its five-year average, the issuance in investment-grade bonds is on track to set a new full-year record (Figure-4). This partly reflects the focus of the ECB’s measures on investment grade debt and European investors relative lack of appetite for junk-rated debt.
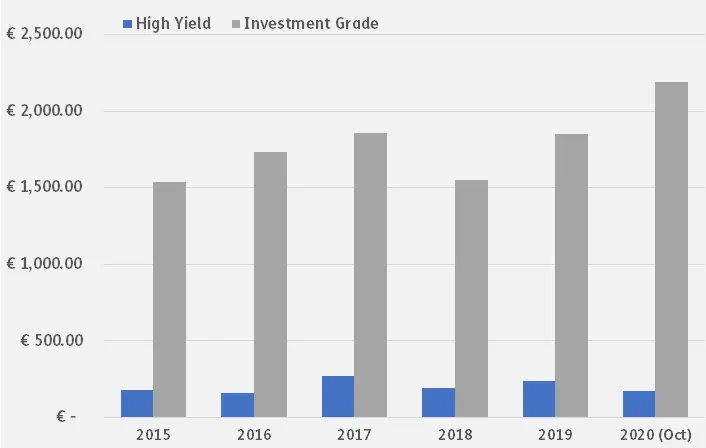
Figure-4 Yearly Bond Issuance Volume in Europe by Issuer Rating
Follow the flows
2020 has shown that, in terms of issuance, rating categories and industries can diverge significantly depending on the broader political and economic environments. These divergences, and the insights about the supply and demand dynamics of the market they provide, can be harnessed to improve future returns.
A simple quant model using deal flows in the European bond market to rotate between industries has shown a strong performance in recent years. The strategy is based on percentage corporate bond deal flow into different sectors.
The percentage deal flow is simply defined as the 20-day cumulative total – in US$ – for nominal deal flows divided by the latest 60-day cumulative nominal deal flow into each sector. The strategy then ranks sectors according to this percentage deal flow metric, then goes long the higher-ranking sectors and goes short the lower ranking sectors.
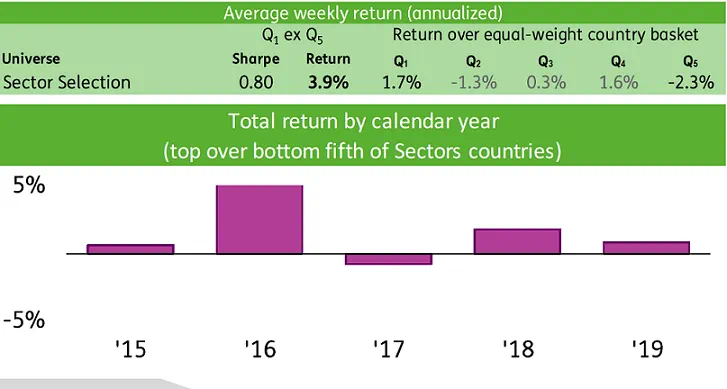
This strategy has generated a Sharpe ratio around 0.8 during the last five years, delivering a 3.9% excess return (See table and chart below)
European Bond Industry Rotation Deal Flow Strategy
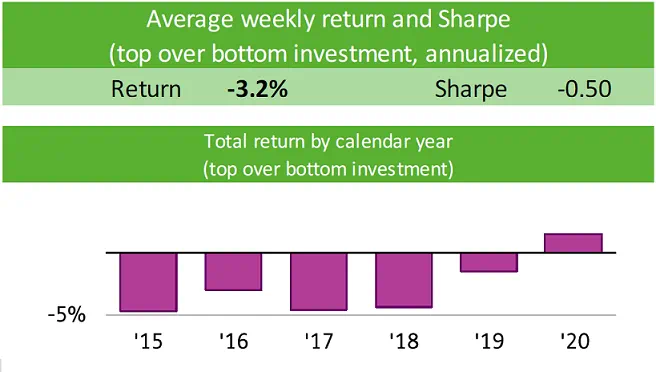
A similar strategy, using the same methodology to capture shifts between investment grade and high yield European debt, also generates good results from a contrarian perspective. (See table and chart below)
European Bond HY vs IG Rotation Deal Flow Strategy
Filters that work
High volumes of debt issuance can drown out the signals that fixed income investors have historically relied on. But understanding supply and demand conditions, and applying the right filters, helps to overcome this problem.
Harnessing IGM’s deals data, with its near real-time coverage of primary markets, to the right quantitative framework is one way to capitalize on European debt markets.
Did you find this useful? Get our EPFR Insights delivered to your inbox.


