In a previous quants corner, we noted the increasing allocation by active fund managers to Hong Kong listed Chinese securities (H shares, Red chips and P chips) and, as a result, the steady drop in their underweight relative to the benchmark (see Chart 1 below).
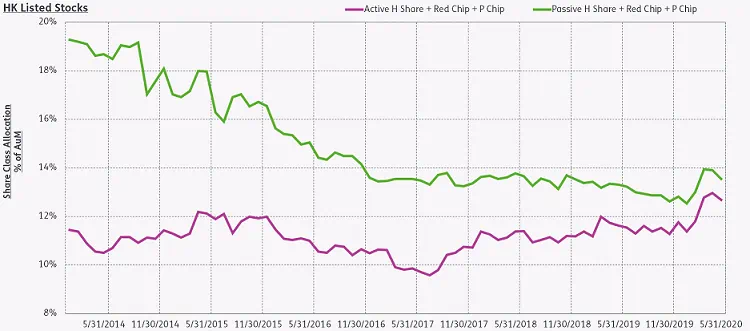
Chart 1 – Simple Weighted Average Allocation to Hong Kong listed stocks (Active vs Passive)
That trend accelerated as the Covid-19 epidemic tightened its grip on China and then became a global pandemic.
Two months later the backdrop is very different. Most of China’s citizens are living and working largely free of the restrictions imposed during the first quarter lockdown.
With China further along the road to a “new normal” than most of its peers, what new trends are emerging from the China Share Class Allocations dataset, and what signals are being generated by the quantitative approaches outlined in previous Quant’s Corner posts?
AIS weighing on H share performance
In our May post, we showed that the monthly change in Active Investor Spread (AIS), representing the difference between active and passive fund allocations to a given share class, has value as a reversal signal. Unlocking this value involves shorting the asset if the AIS widens and going long if the spread narrows.
For Hong Kong listed stocks, both active and passive managers have reversed direction. In the process, a spread that has narrowed steadily since 3Q17 has been widening for the last three months (see Chart 2 below), during which time the benchmark’s performance has struggled.
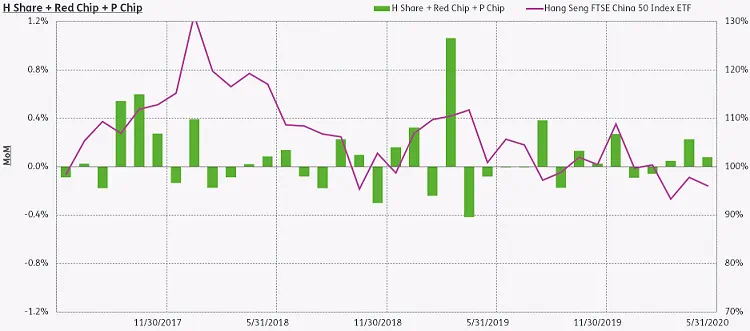
Chart 2 – AIS MoM vs ETF performance
Based on this trend, EPFR’s China Share Class Allocations data is still sending a short signal for H shares.
Dragging their active feet on A and foreign listed shares
While passive managers track the A and B share allocations of major indexes higher, active managers have increased their underweight to domestically listed Chinese share classes since the year began (see Chart 3 below).
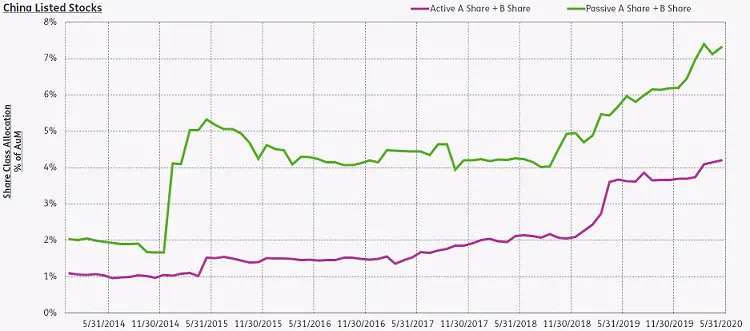
Chart 3 – Simple Weighted Average Allocation to domestic China listed stocks (Active vs Passive)
Although active managers allocations to foreign listed Chinese stocks reached a historical high, they clearly started tapping the brakes in April and May (see Chart 4 below).
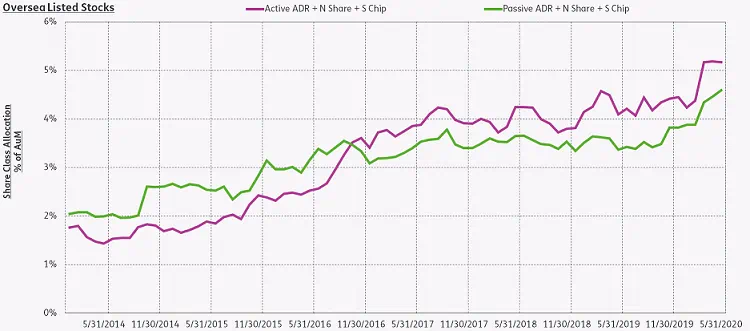
Chart 4 – Simple Weighted Average Allocation to foreign listed China stocks (Active vs Passive)
While it’s hard to tell the whether the active allocation will remain on its current plateau, passive allocations to ADRs, N shares and S chips continue to rise. That suggests the AIS will continue to narrow and, based on our current model, investors should go long foreign listed share classes despite US threats to delist Chinese companies.
Sleepwalking, but to profits or a cliff?
Overall, passive managers who follow the benchmark continue to increase their holdings of domestically and foreign listed Chinese stocks. But active managers are less bullish. They seem willing to wait until the state of Sino-US relations in a post-pandemic world become clearer.
Even though China’s domestic equity market has staged a solid rebound, the developed markets (DM) benchmark has outperformed the China benchmark from late March to end of May.
With these different dynamics at play, it seems likely that the AIS will keep increasing for A, B and H shares but narrow for foreign-listed share classes.
Did you find this useful? Get our EPFR Insights delivered to your inbox.


