In early June hundreds of Venetians gathered to protest the return of giant cruise ships to their famous city on Italy’s Adriatic coast. Waving flags and signs bearing the words “No Big Ships,” they reiterated their opposition to the passage of vessels often weighing over 100,000 tons through canals originally engineered for sailing ships and galleys.
The giant vessels have long been the targets of environmentalists, preservationists, and plain old not-in-my-backyard (NIMBY) advocates around the world. But, so far, their passage has not — at least visibly — drawn the ire of investors.
Those investors may be missing something. Analysis by EPFR’s Quant Team, utilizing data supplied by a sister company, suggests that the volume of cruise ship traffic is inversely correlated with the performance of the destination country’s stock market.
This blog will outline how we reached this conclusion.
Rowing together
For 300 years, Lloyd’s List Intelligence has overseen one of the world’s largest and most widely referenced maritime intelligence database. Lloyd’s List Intelligence compiled a database of port callings by country to evaluate and serve as the basis for a predictive model.
The dataset generated by Lloyd’s List Intelligence summarizes port calls, aggregated to the country level by vessel type, for the period from January 2000 to June 2021. At the country level it covers Australia, Japan, Singapore, Israel, New Zealand, Norway, Sweden, United Kingdom, Belgium, Denmark, Finland, France, Germany, Greece, Ireland, Italy, Netherlands, Portugal, Hong Kong, and Spain. These are the countries that were represented in the benchmark MSCI EAFE from January 2000 to December 2020. The only countries that were part of the index but are excluded from the dataset, Austria, and Switzerland, are both landlocked.
The data set captures the total number of ships arriving at ports within the listed countries during a given calendar month. Only international arrivals are included; intra-country transits are filtered out.
In terms of timeliness, most port callings are generated using automatic identification system (AIS) data generated by onboard transponders. As such, these datapoints are usually available within the hour. The remainder of port callings are generated via human intelligence — observations by actual people — and are recorded in the database within 48 hours.
It should be noted that a port calling is considered complete only when the vessel leaves port. This can take one to two weeks.
To eliminate any look-ahead bias, the data is lagged by one month. Thus, for example, April port callings will be used to predict June country equity-market returns.
All ships
Our research utilizes the returns of international stock market indexes. All source data are obtained from the Bloomberg database. Following the methodology of Zaremba (2015), we adopted Morgan Stanley Capital International (MSCI) indexes for all the countries to maintain a consistent return computation methodology.
The returns are computed based on cap-weighted net total return indexes; that is, the returns are adjusted for corporate actions (splits, reverse splits, issuance rights etc.) and cash distributions to investors (dividends). The “net” technique of computation ensures that the returns account for country-specific dividend tax rates. The return series are monthly, and the sample period runs from January 2000 to December 2020.
In the Lloyd’s List Intelligence dataset, each vessel type maps up into one of five main types: Passenger, Unitized cargo, Tanker, Dry cargo and Other. Aggregating up to this level gives us five indicators for each country and month. In addition, total port callings, by country and month, were also computed and labelled as “Total” which we substituted for the catch-all “Other” category.
With these five indicators in hand, country equity-market forward returns were brought into the analysis. For reasons mentioned above, a one-month lag was introduced so that, for example, April port callings were used to predict June country returns. To better predict equity markets on a relative basis, country returns were mean adjusted and the predictors z-scored within each month.
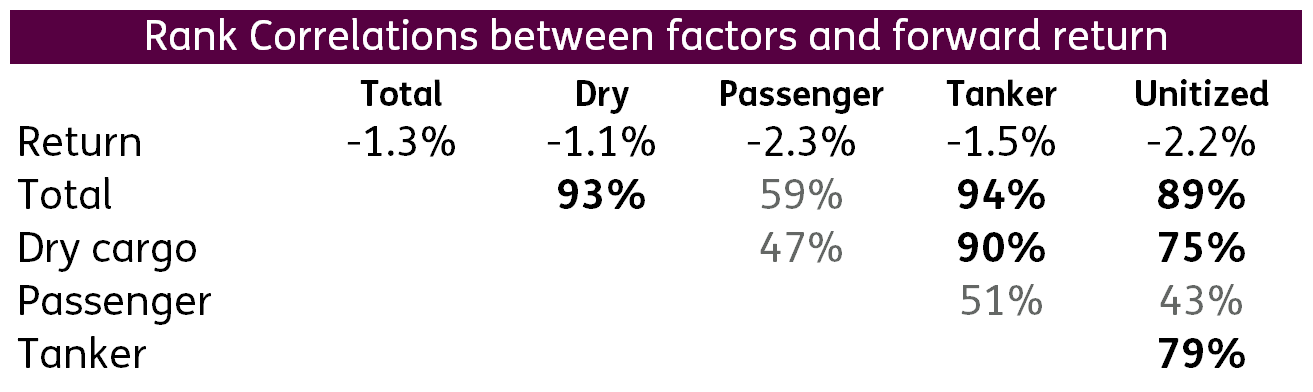
After rank correlations across the entire resulting dataset were computed, the following observations can be made:
1.Many of the predictors are highly correlated with each other so one must handle multi-variable regression carefully.
2.The predictors are negatively correlated with forward return (See table below).
Full astern
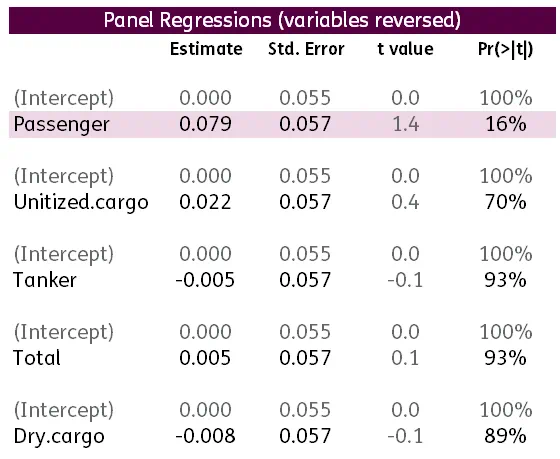
In light of this negative correlation, our next step was to reverse each of the predictors by multiplying it by negative one.
Uni-variate regressions were now run between each of the predictors and forward return. As is apparent from the table below, the “Passenger” category proved the most predictive, with a t-statistic above one.
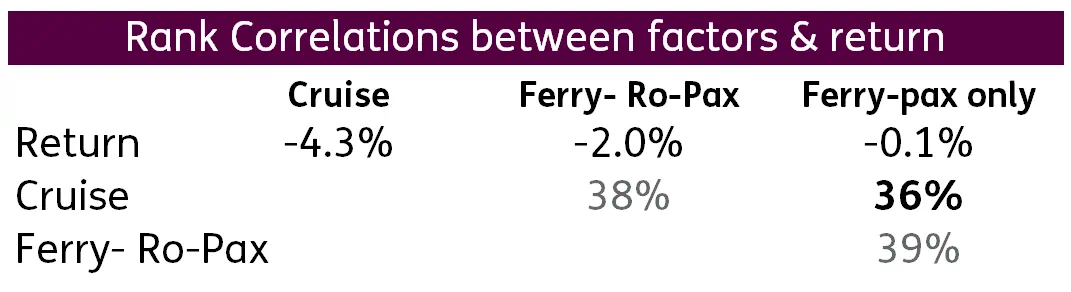
As the “Passenger” category appeared the most predictive of the five we examined, we focused it and its sub-sets. Three vessel-type groups underly the “Passenger” main type. These are “Cruise”, “Ferry- Ro-Pax” and “Ferry-pax only”.
These three predictors, for each country and month, were now brought together with forward return using the same one-month lag as before. Within each month, the predictors were again z-scored and the returns mean-adjusted.
Again, the predictors are negatively correlated with forward return causing us to reverse the predictors. This can be seen from the table below.
Uni-variate regressions were again run between each of the predictors and forward return. The results are reported in the table below.
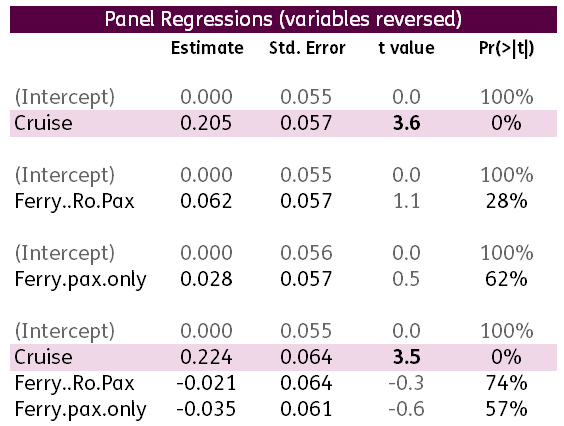
Cruise port callings turn out to be significant, with a t-statistic well above 2. Neither of the other predictors generated significant results, either by themselves or in conjunction with port callings of cruise ships.
The protesters may be right
A factor may be significant without being powerful. To confirm this last point, EAFE countries were ranked into five buckets based on latest-available — or one-month lagged — cruise ship callings by country. Quintile one had the fewest number of port callings while quintile five had the most.
In each case, only countries that were actually in MSCI EAFE over the trade month were included. This required taking into account that:
- Greece was added after May 2001.
- Israel was added after May 2010.
- Greece was removed after November 2013.
The table below shows mean annualized quintile returns. These returns are reported relative to that of the equal-weight basket of EAFE countries excluding Austria and Switzerland. The “Q1 ex Q5” shows the mean annualized return of the low-cruise-call bucket Q1 over that of the high-cruise-call bucket Q5. The column labelled “Sharpe” is the ratio between the annualized average and standard deviation of the return difference between the low-cruise-call bucket Q1 over that of the high-cruise-call bucket Q5.
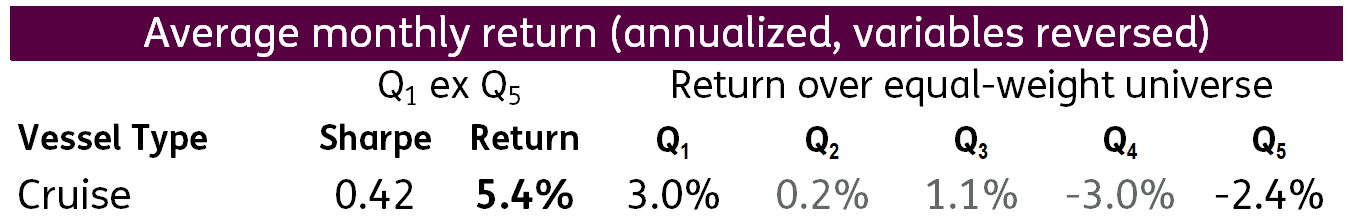
As you can see from the table, latest one-month cruise reversal generates a return over five percent per year if one is willing to go long the countries with the fewest port calls and short the ones with the most.
To conclude, one-month cruise reversal is a significant predictor of country equity markets. A strategy that shorts EAFE countries with the most port callings by cruise ships and goes long the ones with the fewest would historically have generated excess returns of five percent per annum.
Did you find this useful? Get our EPFR Insights delivered to your inbox.


