After more than two decades of tracking mutual fund flows and allocation data, we’ve come to believe that each year, or indeed each time period, has its own special “data signature”.
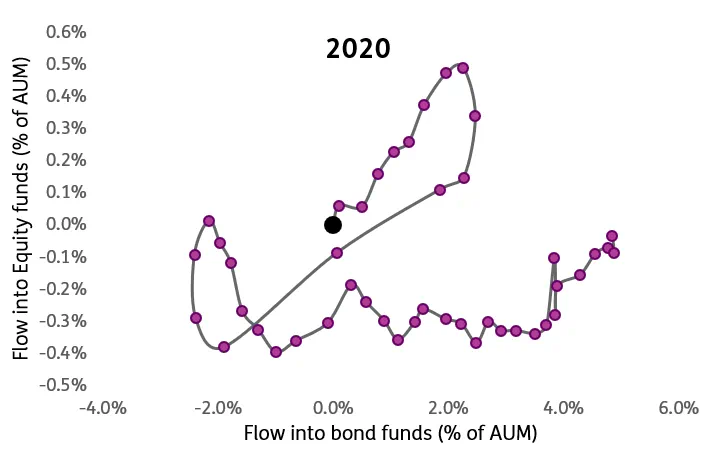
If, for instance, you plot the cumulative weekly flow into EPFR-tracked equity funds against those into bond funds — expressing both as a percentage of assets under management — you end up with a random trail that reflects the uncertainty or confidence felt by markets over a given period of time.
By that measure, 2020 has been a crazy one indeed, as befits a year that has seen the Covid-19 pandemic and the swansong of Donald Trump’s presidency.
In contrast to most of the blogs that appear on Quant’s Corner, this one will spend more time looking at the writing on the 2020 wall than trying to translate it through quantitative analysis into actionable strategies, signals and models.
Pining for the good old days?
The joint movements of equity and bond fund flows during this year look like kind of thing that is usually trotted out for psychological evaluations. Can you look at this image and tell me what you see? Rising cobra? Symbol for the British pound sterling being stamped into the ground?
Initially, until the final days of February, money poured into both equity and bond funds. Later those inflows were entirely reversed, with the redemptions being parked in Money Market Funds which absorbed over $1 trillion in March and April. After the initial rush for the exits there was a period where money went into fixed income, but not equities, and, finally, a period where money at least returned to equities.
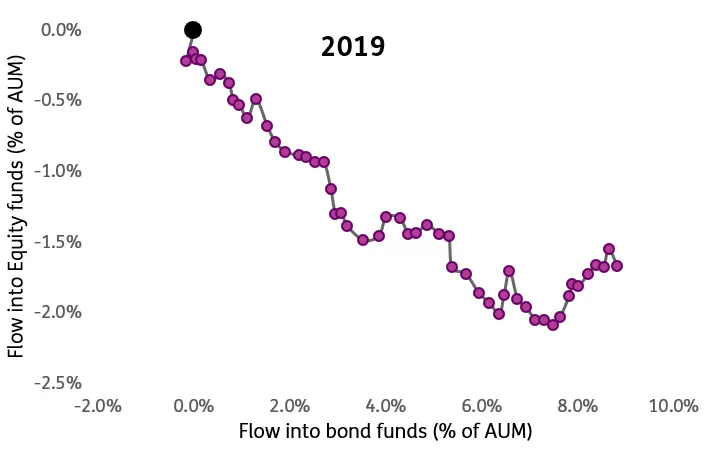
The contrast with the linear ‘signature’ for 2019 could not be starker, reflecting a normal, if not downright boring, year.
Behind these broad signatures, there is a lot of fine print relating to geography, sectors and other aspects of the EPFR databases.
The case for long Czech, short Slovak
Among the ways EPFR classifies funds is where, geographically, they have a mandate to invest. This opens the door for simple comparative analysis based on flows into or out of fund groups dedicated to countries or regions.
For the purposes of this year-end tour we computed, for each week this year, the total flow into all funds with a given geographic investment mandate. We did this for both equity and bond funds, expressing the results as a percentage of assets under management.
The table below shows the top ten country groups by cumulative inflow, outflow and annualized volatility over this past year.
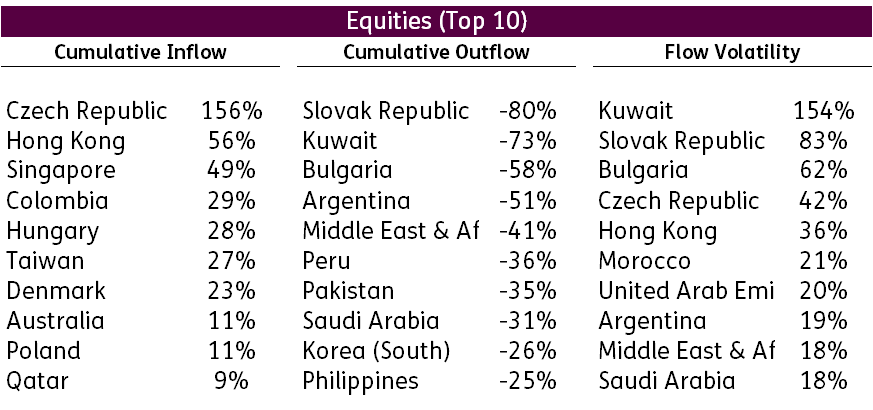
As you can see from the table, in 2020 equity investors showed the greatest conviction when it came to smaller regional markets. They pumped up the asset bases of groups dedicated to countries such as Colombia, Qatar and Poland while fleeing others dedicated to markets such as the Philippines, Pakistan and Saudi Arabia.
Some of the markets that feature on these lists are also to be found amongst the ones with high flow volatility.
Giving bond funds the same treatment as equities yields a similar table.
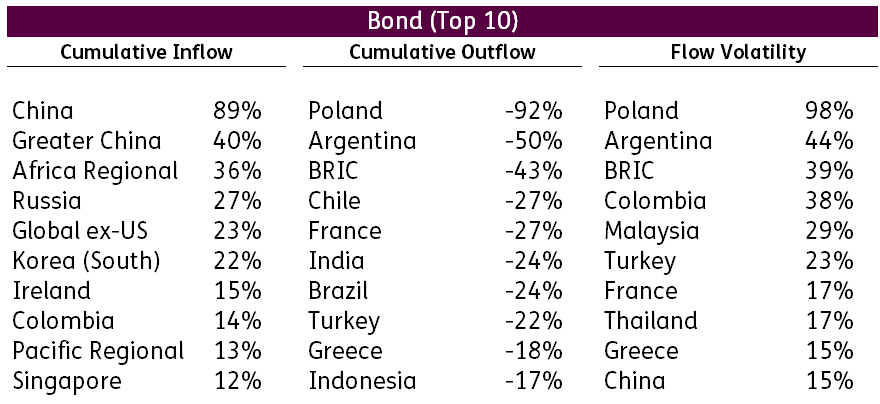
Here money poured into China and Global ex-US funds, while avoiding France, Turkey and the BRICs theme.
This year’s style has a corporate growth feel
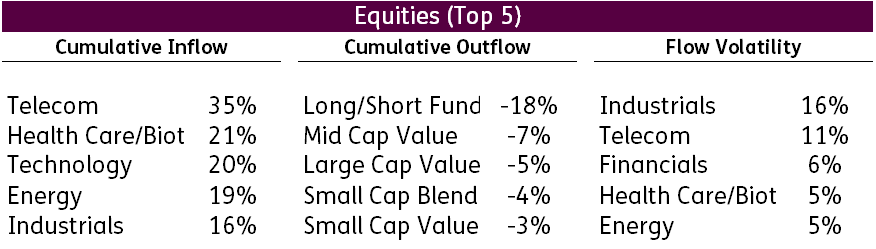
EPFR also classifies funds based on their style, the sector or asset class they have a mandate to invest in and the duration of the assets they hold.
For each week this year we computed total flow into all Equity Funds with that style or sector mandate, again expressing the results as a percentage of assets under management.
As you can see from the table below, this year, equity investors fled value funds of all stripes in favor sectors catering to remote working, online shopping and the search for an effective CVID-19 vaccine.
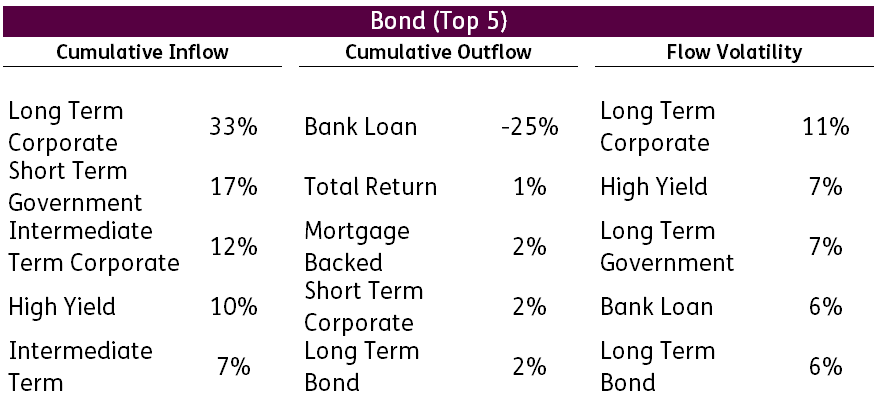
Fixed income investors, meanwhile, sated their hunger with investment grade corporate and junk bond funds while fleeing Bank Loan Funds.
Our conclusion
The conflicting hunts for yield, safety and capital appreciation are taking investors and their money in a variety of directions – often at the same time.
But, humor aside, there are still trends that can be identified and money that can be made. Expect a return to more actionable handwriting analysis in future blog posts.
Did you find this useful? Get our EPFR Insights delivered to your inbox.


