Sino-US trade tensions and slower growth in the world’s second-largest economy have dominated the headlines for much of this year. But, behind the sound and fury, many mutual fund managers have – with varying degrees of enthusiasm – been increasing their fund’s exposure to China.
The main catalyst for this is the quadrupling, in phased steps, by MSCI of Chinese A shares weighing in their global indexes. This has spurred EPFR-tracked Global Emerging Markets (GEM) Equity Fund managers to further boost allocations for a market many of them have reservations about, at least in the short run.
For quantitative analysts, finding a signal when structural forces – the MSCI rebalancing – rather than fundamental ones are driving allocations in one direction poses a challenge. But there is a way.
Shrugging off the great financial crisis and China’s bout of equity market instability in mid-2015, GEM fund managers have steadily raised their allocation to China over the past two decades. In 1Q00, the average weighting for China among EPFR-tracked GEM funds was under 2%. Going into August of this year, the average GEM Fund was devoting over a quarter of its portfolio to Chinese stocks (See Chart 1 below).
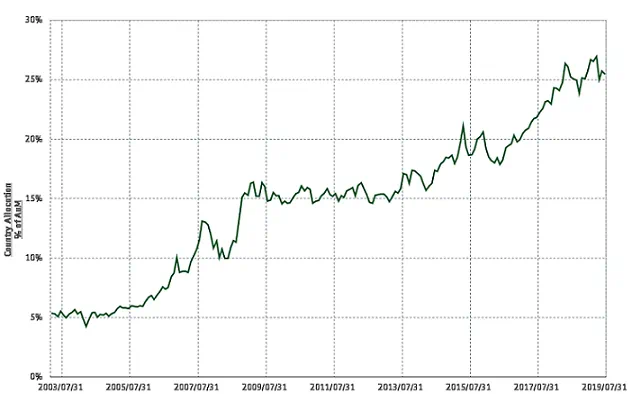
Chart 1 – Simple Weighted Average of GEM Funds allocation to China
It is worth noting that this trend of rising GEM Fund allocations, which is also mirrored in other diversified groups such as Asia ex-Japan and Pacific Equity Funds, has resulted in significant capital inflow to Chinese equity markets. The AuM of all EPFR-racked Equity Fund holdings, illustrated in Chart 2 below, topped the $600 billion mark for the first time in early 1Q18. (Due to the weak performance of Chinese equity markets this year that total currently stands at $596 billion).
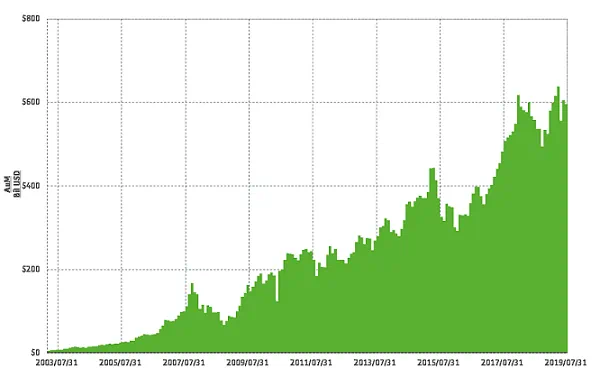
Chart 2 – Total Assets Allocated to China equity
Of that roughly $600 billion, over a third is managed by GEM funds, while China dedicated funds accounting for some 15% and other regional fund groups the balance (See chart No. 3).
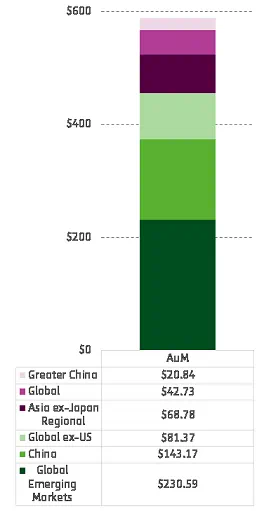
Chart 3 – Total Assets Allocated to China equity, by fund geographic focus
It is therefore logical that GEM Fund allocations data has the potential for producing the strongest directional signal. But how to unlock that signal? The key is in the split between actively and passively managed funds.
Compared to GEM ETFs, actively managed GEM funds consistently underweighted China until early 4Q14. During the rally of China’s equity markets in the first half of 2015, active managers shifted to an overweight stance of China that lasted for most of the year (see Chart 4). After slipping back in 2016, active GEM fund managers have been overweight China relative to their passively managed peers for the past two and a half years.
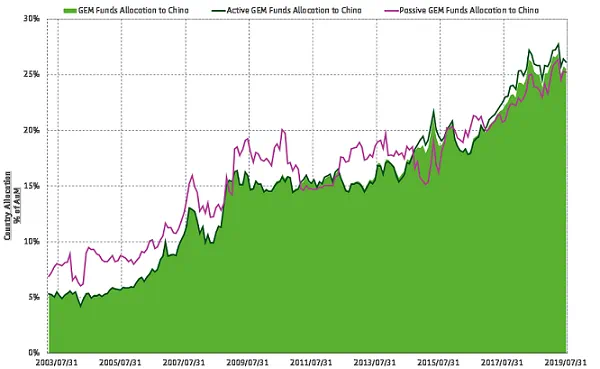
Chart 4 – GEM Funds Allocation to China
However, this collective overweighting of China by active managers comes with a big asterisk. When you compare the percentage of active GEM funds that overweight or underweight China (Chart 5), the majority of the active GEM funds are still underweighting China’s equity market. From year 2009 to 2014 the gap closed, but it has widened again over the past five years.
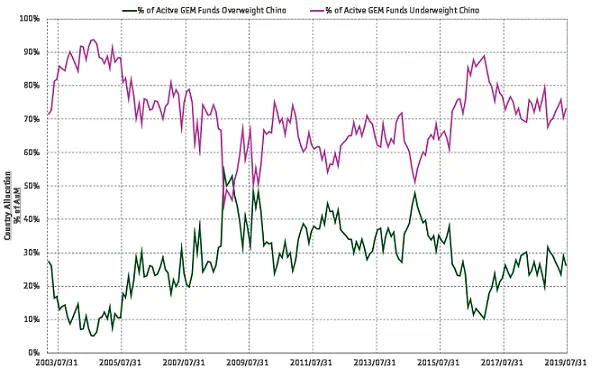
Chart 5 – % of Active GEM Funds Allocation Overweight/Underweight
With this in mind, we opted to build a model whose key variable looks at the behavior of the funds from a flow perspective – the net number of funds experiencing inflows as a percentage of all funds being tracked (ION).
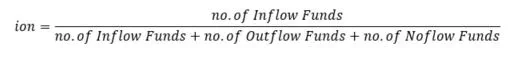
Chart 6 – ion Variable Calculation
Utilizing the weekly version of this variable, a 10-week-moving average and standard deviation are computed in order to calculate a P(probability)-value. The P-values then play two roles in our model. Rolled into a 10-week moving average, they create a band (see Chart 7) that allows us to pursue a band trading strategy based on where the weekly P-value scores fall.
Our strategy follows the rule that the sentiment is considered neutral if the P-value falls in the band, positive if it falls above the band, and negative if it falls below the band. Specifically, if the P-value is greater than 60%, it’s a bullish signal (inviting a long position), but if the P-value is smaller than 40% then investors using the strategy to invest in China should short the market.
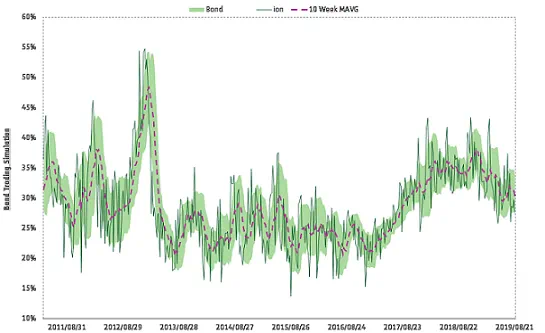
Chart 7 – Band Trading Strategy Simulation
A simulation of this band trading strategy from 2011 to the present has handily outperformed the MXCN Index benchmark (see Chart 8).
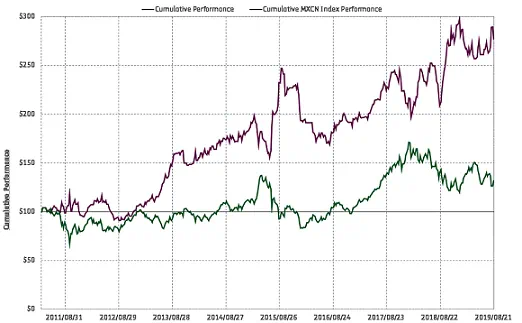
Chart 8 – Band Trading Strategy Cumulative Performance
A simulation of this band trading strategy from 2011 to the present has handily outperformed the MXCN Index benchmark (see Chart 8).
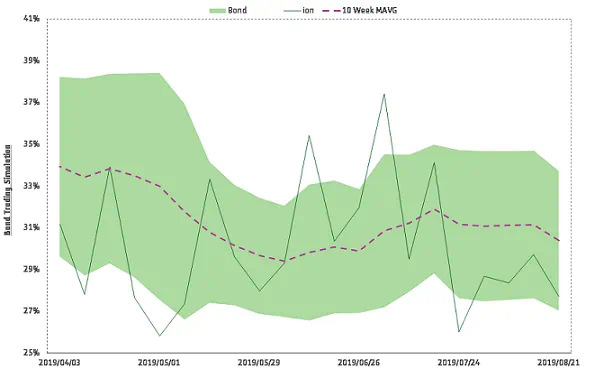
Chart 9 – Band Trading Strategy Simulation – Q2TD
What next? We chose the 10-week moving average because of the high turnover and aggressive retail trading that characterizes China’s market. Except in extreme circumstances, those traders tend to chase this market back to its mean. So the odds – and the fact US and Chinese officials will resume trade talks in October — favor a moderate rebound in the near future.
Did you find this useful? Get our EPFR Insights delivered to your inbox.


