EPFR subscribers have traditionally looked at the kinds of funds money is moving into. Active or passive? ETF or mutual fund? Equity or Bond? Energy or Technology? They have also looked at where: Pacific or Europe, Global or GEM.
They have usually overlooked factors.
Based on their prospectus, EPFR’s data team classifies funds by Style (Growth/Value/Blend), Size (Large/Mid/Small) and Social Responsibility (ESG/not ESG). However, merely by looking at past returns, it is also possible to also classify funds by Momentum, Reversal, Volatility, Beta and Oil Sensitivity. Finally, to add icing to the cake, it is possible to classify funds based on Flow.
This blog details what happens, both in terms of additional information and for returns, when you break down money flow in terms of these factors.
Dramatis Persona: The Factors
Thanks to the prospectus, we already have the following classifications for a given fund:
- Style – growth versus value funds
- Social Responsibility – socially responsible versus other funds
- Size – large versus small funds
Extracting returns from EPFR’s weekly fund-flow database over the prior fifty-two weeks, we can compute the following factors:
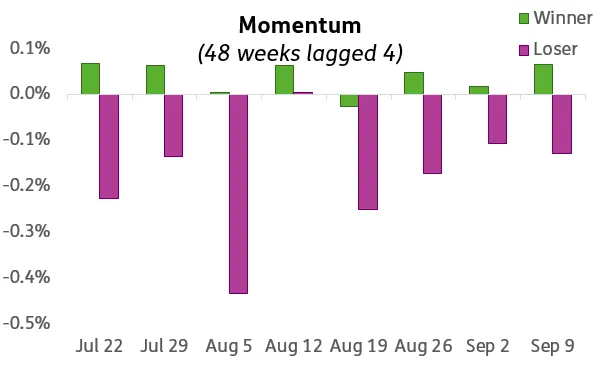
- Momentum (LtMo) – top, middle or bottom third of funds ranked on 48-week return that are lagged by four weeks
- Reversal – top, middle or bottom third of funds ranked on four-week return reversal
- Volatility – top, middle or bottom third of funds ranked on standard deviation of fifty-two-week return
- Beta – top, middle or bottom third of funds ranked on beta versus the S&P 500 over the prior fifty-two-weeks
- Oil Sensitivity – top, middle or bottom third of funds ranked on the coefficient derived from the regression of fund returns against those of Brent Crude and the S&P 500 over the prior fifty-two weeks
Finally, extracting flow, rather than return, from EPFR’s weekly fund-flow database over the prior four weeks, we can classify funds by:
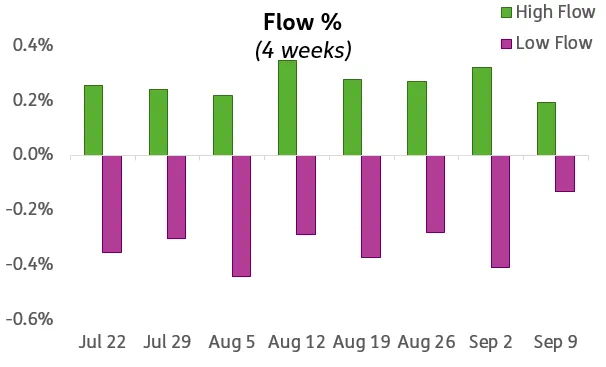
- Flow % (FloMo) – top, middle or bottom third of funds ranked on prior four-week flow expressed as a percentage of assets under management.
For Flow % we use four weeks rather than 52 based on the findings of Srimurthy et. al.[1].
Factor Flow
For each factor, we focus on flows into the applicable equity funds, ranking the funds by net flow and dividing that ranking by three. We then focus on the thirds that belong on either end, ignoring the middle.
For instance, when it comes Momentum, we look at the top and bottom third of funds based on 48-week return, lagged four weeks, but ignore those in the middle third. For Style we focus on Growth and Value funds, ignoring the blend funds in the middle.
The chart below shows returns to each of the factors over the week ended September 9th when renewed fears of a “second wave” of Covid-19 infections – and the economic costs of combating this wave – hit global markets.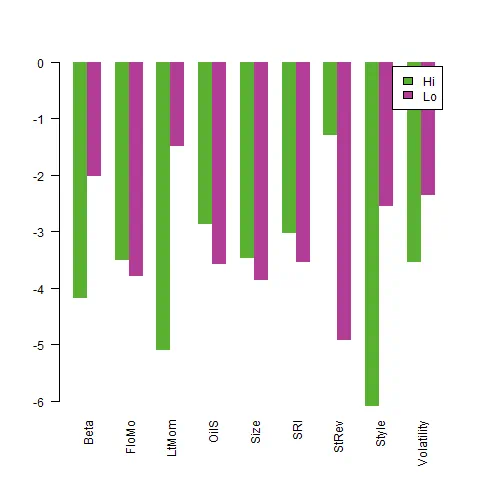
As you can see from the chart, there were no positive factor returns. Everything was being sold off indiscriminately. But the factors did send a clear signal when it came to which ones retained the confidence – expressed in the form of additional flows to the relevant funds — of investors.
The week ended Sept. 9 saw inflows into Flow %, Momentum and Size and outflows from Beta and Volatility (see chart below). We recognize inflow into a factor when the top third of the cohort experiences an asset-weighted inflow and the bottom third suffers an outflow. A factor suffers an outflow when the reverse happens. This inflow/outflow signal does not depend on the top third’s total inflow being larger than the bottom third’s outflow or vice versa, something to remember when viewing the relative size of the bars in this blog’s subsequent charts. All that matters is that the flows for the top and bottom thirds have opposite signs.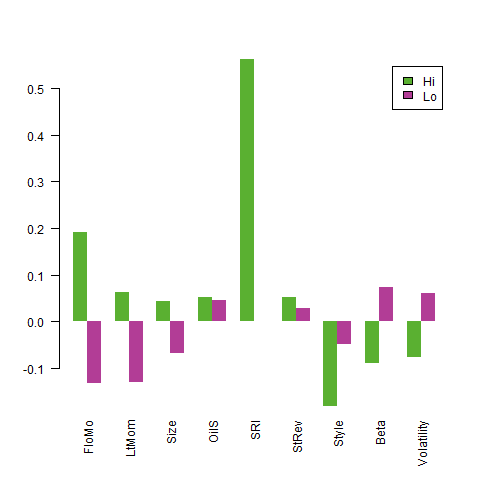
But can we exploit this knowledge? How long has money poured into Flow %, Momentum and Size and out of Beta and Volatility? Might this persist? To answer this, we look at factor flow through time.
Factor Flow Momentum
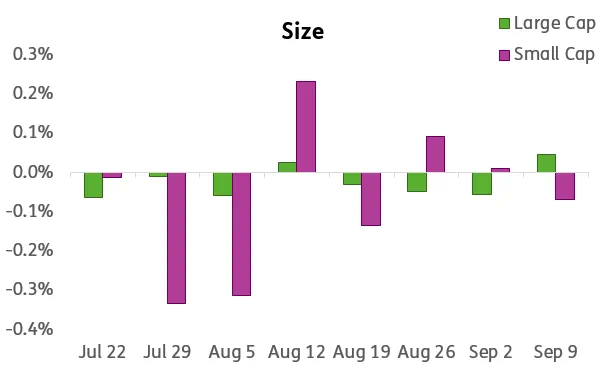
To start, we drill down deeper into each of the factors that had a clear directional flow by looking at the prior eight weeks.
We can discount the significance of flows into Size because the week ending Sept. 9 was only the first week of flows into that factor.
We’re on firmer ground with Beta and Volatility — related notions – which, having suffered outflows for two weeks, are more likely to see continued outflows (See following charts).
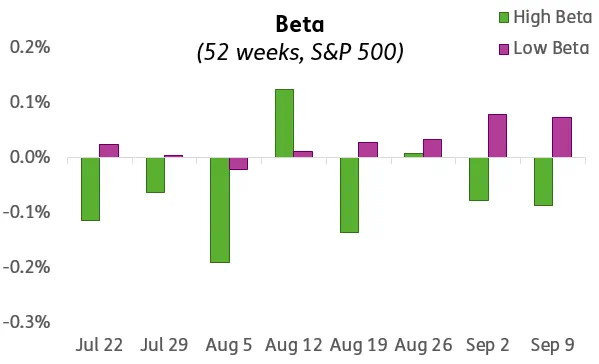
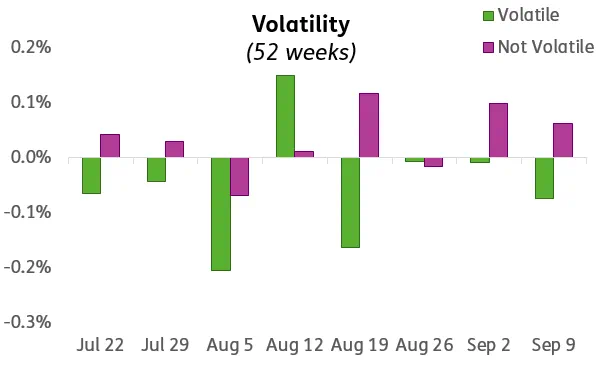
However, the greatest significance should be assigned to Momentum and Flow %, which have been seeing inflows for three and eight weeks respectively.
How do we profit from this?
Consider a factor for which we expect inflows or outflows to persist. We can look at the kinds of funds that score on the extremes of that factor range of returns. Then we can either (1) directly buy the funds we expect to benefit from the prevailing factor winds or (2) buy the kinds of securities these funds own.
Conversely, we can avoid the types of investments that are currently out of favor.
Did you find this useful? Get our EPFR Insights delivered to your inbox.


