The US Federal Reserve believes the recent gains made by inflation will be temporary, and that the headline rate will be at or around its 2% level going into 2022. Investors are not so sure.
Since the beginning of 3Q20, EPFR-tracked Inflation Protected Bond Funds have recorded inflows 40 of the 43 weeks through mid-April of this year. US Bank Loan Funds, meanwhile, have taken in fresh money all but one week year-to-date. During 2020 this fund group, traditionally viewed as a way to play rising short term interest rates, posted outflows 41 of the year’s 52 weeks.
Since inflation has – at least officially – been largely absent for over a decade, many of the investment strategies for dealing with it, such as focusing on precious metals, real estate or other tangible assets, have a fair amount of dust on them.
In this blog, we will look at this issue from the industry level, aiming to identify those that will fare best of the inflation’s recent gains prove not to be transitory.
Insuring against inflation?
To measure the different sensitivities among industrial groups to inflation, we utilize EPFR’s industry allocations data. This is an as-reported dataset with a monthly frequency.
To begin with we obtained industry returns. We did so by regressing, across all the funds that reported both industry allocations as well as monthly flows, the monthly fund return on that fund’s industry allocations. We repeated this exercise for each of the last 24 months through February 2021, the latest month for which we had industry allocations data.
Next, for each industry we regressed the time series of industry returns against the monthly S&P 500 return and the month-over-month percentage change in the Consumer Price Index (CPI). Thus, for each industry, we have a coefficient on the CPI. Industries with higher coefficients do better when inflation is higher, those with lower coefficients do worse.
The table below shows the eight industries that are most sensitive (or most geared) to inflation. This represents the top third, there being 24 industries in all.
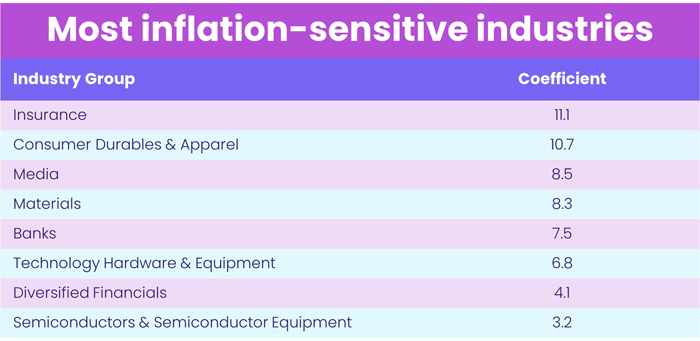
Banks and Insurance, which benefit from interest rate hikes to contain inflation, fall in this group. So, interestingly, do some technology industries.
The next table shows the industries with the lowest CPI coefficients. These are the industries that, based on two years’ worth of data, will suffer most if inflation becomes established.
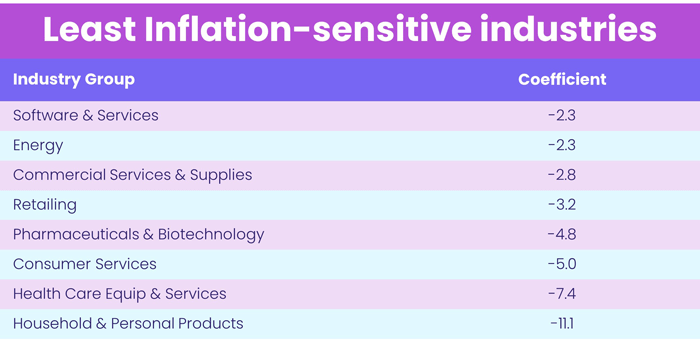
Health care and Pharmaceuticals, two industries historically regarded as have significant pricing power, fall in this group.
Sensitivity pays (modestly)
With the sensitivity analysis completed, we grouped the most sensitive industries into the ‘High’ bucket, the least sensitive into ‘Low’ and the remainder were classified ‘Mid’.
For each fund reporting industry allocations, we aggregated these up to the inflation group level. Then for each week in 2021, for each fund reporting both weekly flows and monthly industry allocations, we split fund flows into ‘High’, ‘Mid’ and ‘Low’ streams, using the latest available industry allocations at the time.
Summing across funds, for each week, we arrived at total dollar flow split by inflation group. Doing the same for starting assets, for each inflation group, we divided total dollar flow by starting assets to arrive at percentage flow.
The chart below shows this flow percentage compounded across time from the end of last year.
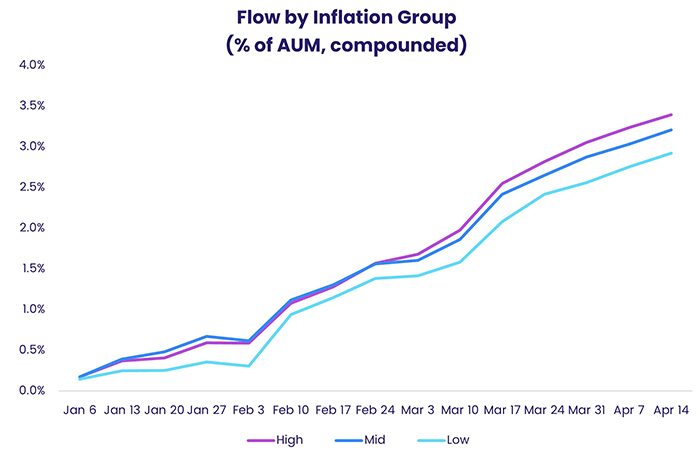
As you can see from the data, investors — at the margin — have been favoring the industries sensitive to inflation while shunning those that would be hurt by rising inflation.
The case for not going back to the dark ages
Our first pass at this kind of analysis captures a short window during a period when inflation was running at historically low rates. Would our correlations be the same if the US inflation ranged between 13.5% and 1.9%, as it did in the 1980s?
Another important question is, would it matter? The US and global economies have changed enormously over the past 40 years. So, what was statistically and quantitatively significant during the final three decades of the 20th century may well be much less so as we move into the third decade of the 21st century.
Did you find this useful? Get our EPFR Insights delivered to your inbox.


