Tech is back! After five months of some ups and more downs, the month of June has been kind to the technology sector. From the mid-May low, the NASDAQ has outperformed the S&P 500 by almost 7%.
If we look in smart beta terms, Growth has outperformed Value by around 11.5% over the same period.
A quick look at EPFR’s Fund Flow Data, however, shows that investors have been slow – or unwilling – to get this message. Going into the final week of the second quarter, funds managed for value had attracted more money, or seen less redeemed, than their growth counterparts in nine of the past 10 weeks. But growth funds had collectively outperformed value funds five of the past six weeks.
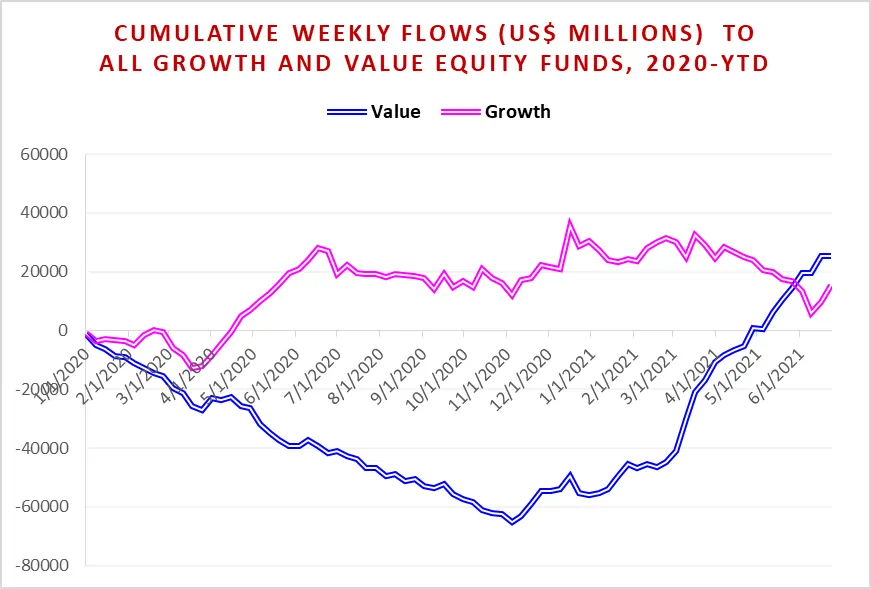
A key question for the second half of 2021 is whether investors are (a) reading the tea leaves correctly when they drag their feet or (b) missing the start of a new and lasting trend. Should they be switching back into technology and other growth stocks?
Polishing up the right crystal ball
Quantitative Insight (Qi) first introduced its proprietary version of Principal Component Analysis in March’s blog, “Inflation, Real Yields & the Million Dollar Question”. That blog started provided an initial look at Qi’s methodology with a particular focus on financial assets’ sensitivity to macro factors – specifically equity markets and their sensitivity to inflation and real yields.
Another output from Qi’s models is a valuation measure. By identifying the independent impact of various macro factors like economic growth, inflation, financial conditions and risk appetite on an asset, Qi can roll that up into an aggregate macro-warranted model value. For example, some of the factors used to evaluate US equities include:
- The track of US GDP growth
- US inflation expectations
- The shape of the US yield curve
- The relative strength of the US dollar
- How the VIX is trading
In practice, Qi isolates macro factors in turn, shifting each one higher by one daily standard deviation. Given the weight on that factor within each principal component (PC) — and given the regression beta estimates — shifting the factor will have some impact on the asset’s valuation.
These independent betas show individual factor sensitivity, as we explained in the March blog, but can also be aggregated together to provide a macro model value. The gap between that value and the asset’s spot price is Qi’s Fair Value Gap (FVG).
Fair value or fair growth?
For discretionary investors, who face a relative dearth of quantitative macro signals, the FVG offers a potential trade idea.
When it comes to allocations between growth and value plays, what is the FVG process signaling?
Below (see Chart 1) we show the NASDAQ vs S&P 500 model from the Qi portal. Macro fair value for that relative value pair on July 7 was $3.33. The R-Squared of that model is 67%, which means that currently Qi’s macro factors can explain 67% of the variance in that ratio, and the difference between spot (the white line) and model values (red line) is 1 sigma which is 2.2% in absolute terms.
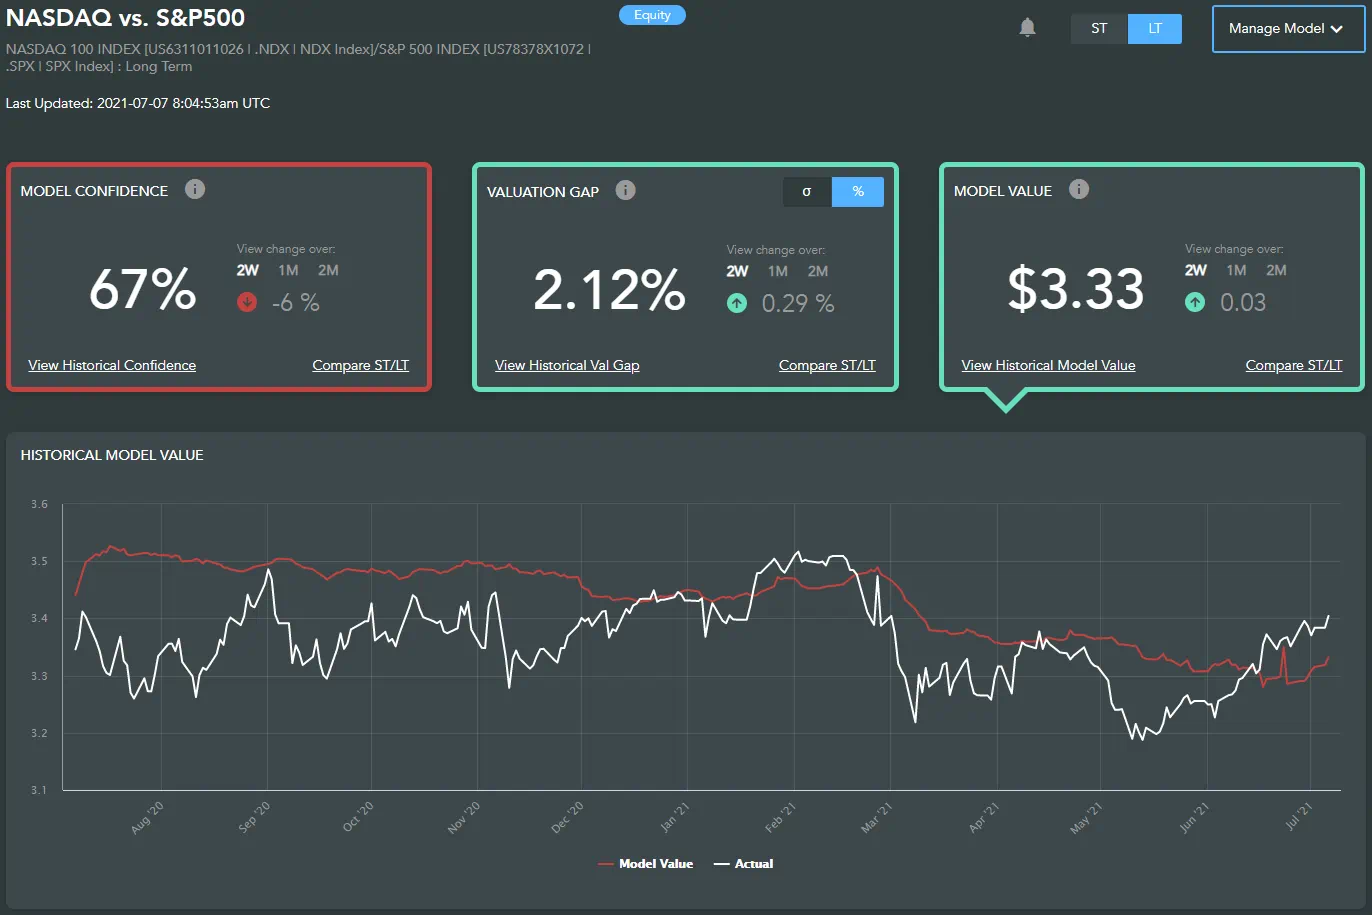
Chart 1
The next chart shows the history of that Fair Value Gap over the past year. Relative to the macro environment, the NASDAQ is close to its richest levels to the S&P 500 as we have seen in the last 12 months.
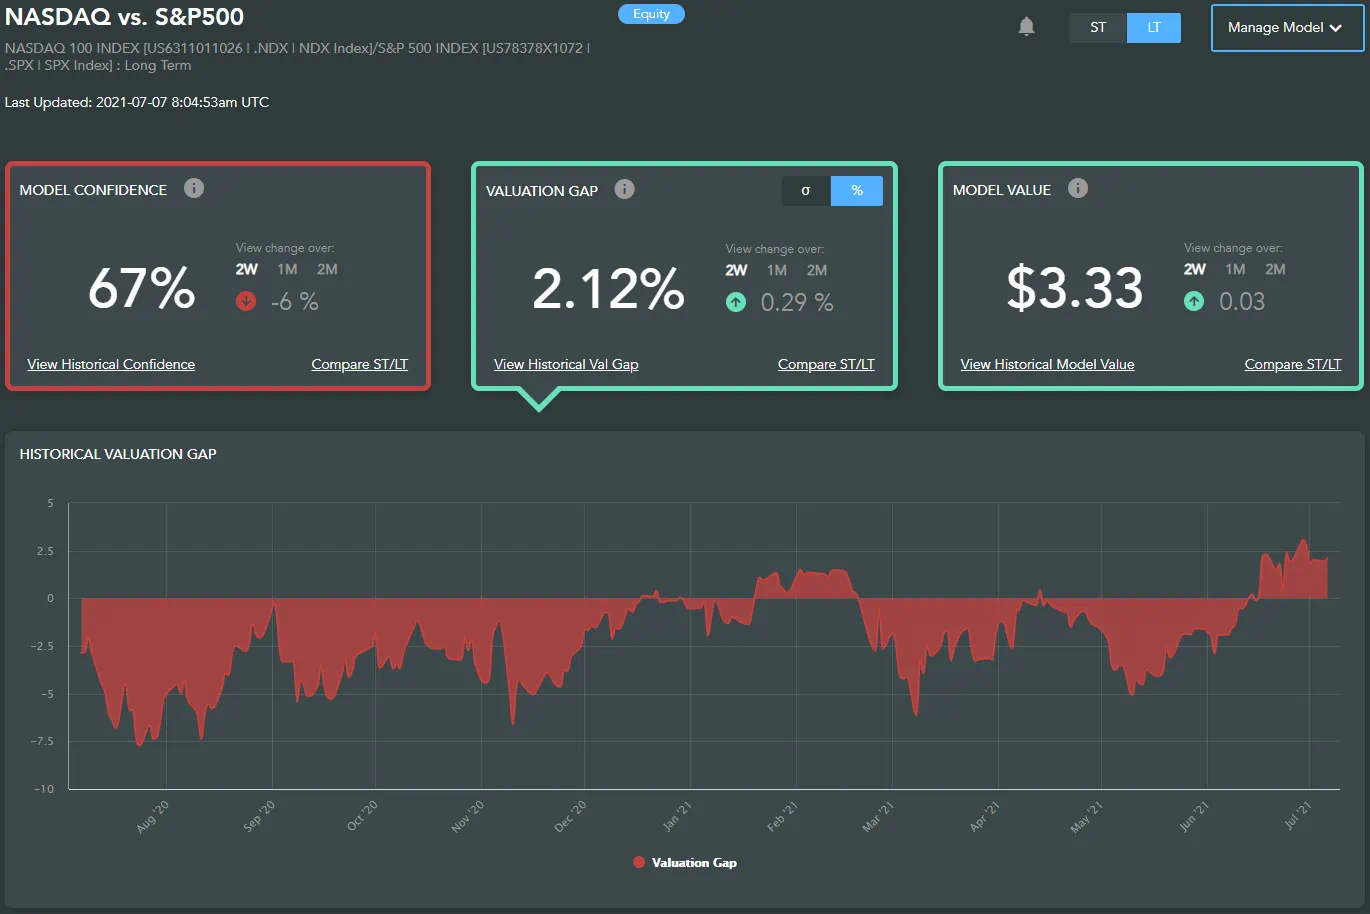
Chart 2
Taking the smart beta approach, we can use Vanguard-tracking ETFs – VTV (Value) versus VUG (Growth) – and we end up with the same general picture.
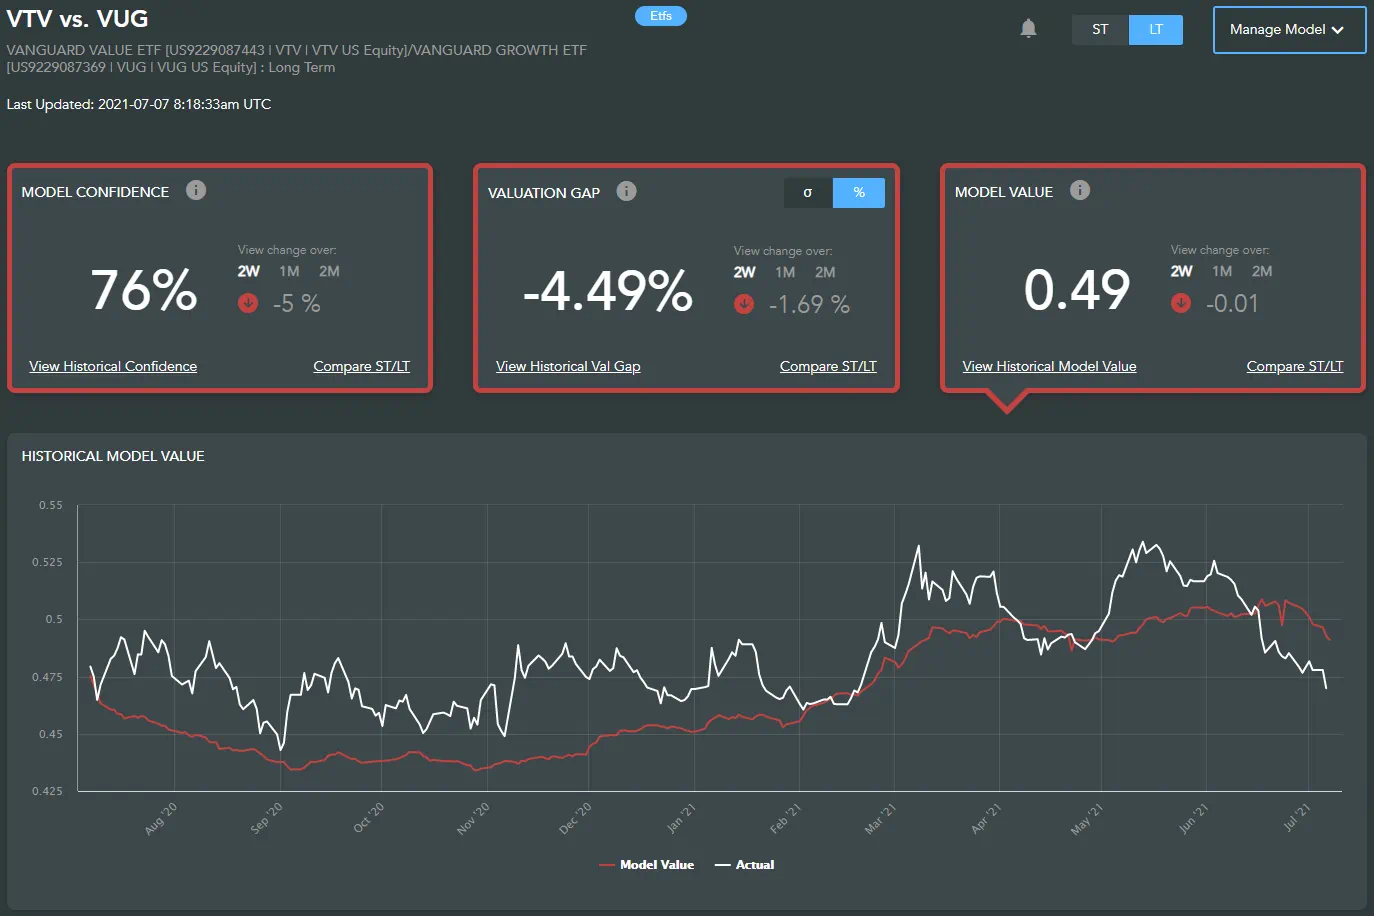
Chart 3
Unsurprisingly the profile looks the same – value has underperformed of late and now sits 1.0 sigma (4.5%) cheap to growth.
Painting the trade alpha
The model is delivering a clear signal, whether applied to the index space or to smart beta vehicles. But maximizing its value to portfolio managers generally requires additional layers of analysis.
A key issue is the reversion of the FVG towards zero. Is the gap closing due to movements in the spot price of the asset, or changes in the factors driving the model? The answer has very different profit and loss implications.
In the case of US equities, the biggest single driver of the VTV/VUG ratio currently is the expectations surrounding monetary policy and the timing of any shift by the Federal Reserve to a tightening bias. This factor alone accounts for around a third of model’s explanatory power (see Chart 4 below).
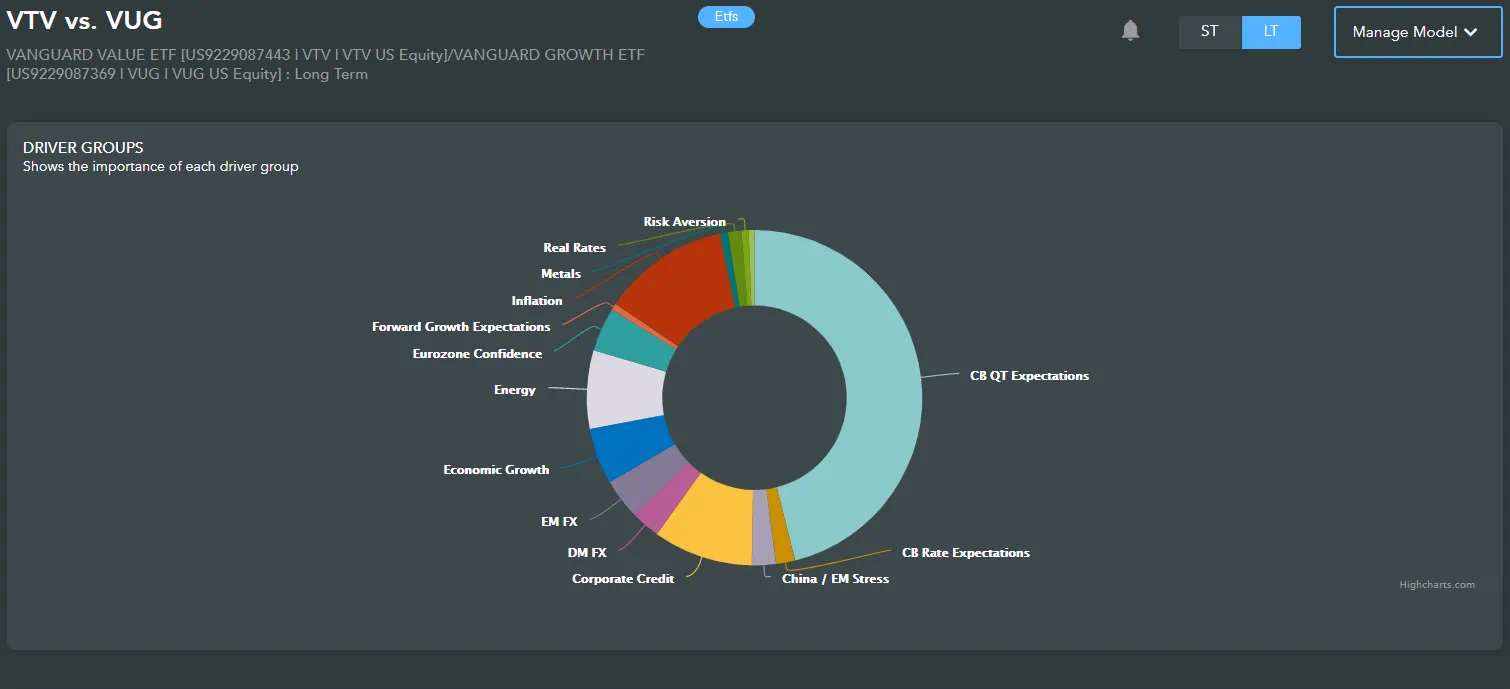
Chart 4
The tech sector is especially reliant on ongoing quantitative easing, a relationship Qi first flagged early in February, and the taper (or data) tantrum of Q1 proved particularly painful for technology stocks.
An understanding of what is driving any asset price is a key part of any investment process. The Qi framework provides an empirical answer so that a discretionary oversight can be added to the initial trade idea.
In this instance, a Growth bull can override the FVG signal providing they have confidence the Fed will prevent another bout of bond volatility / bear steepening of the US yield curve. Conversely, equity PMs with a bearish tilt on the bond market, have ammunition (both from valuations & critical macro relationships) to fade the recent tech outperformance.
At its simplest every quant, portfolio manager and trader is essentially trying to forecast a future price. Aligning macro factor sensitivities with valuation gaps helps provide helps investment professionals do exactly that.
Did you find this useful? Get our EPFR Insights delivered to your inbox.

