Austrian equities look an efficient choice give the dilemma facing investors today. Empirical analysis shows they benefit from rising inflation & from tighter financial conditions. While most analysis will divide winners from losers, a unique machine learning approach identifies key relationships between financial assets & their macro environment. And hence help investors find their optimal trade expression for any macro scenario.
“There is a clear divide in global markets this morning between investors bullish on growth, and those worried about rising yields” – Bloomberg.
This quote from the morning after the March FOMC is perhaps the million dollar question facing investors in 2021. The combination of an aggressive fiscal policy response, an extended period of easy monetary policy & a successful (US & UK) vaccination programme has turbo-charged the re-opening trade.
Traditional, subjective analysts will opine on the best reflation investments. Typically, cyclicals, value stocks, emerging markets & commodities are cited as the chief beneficiaries of an economic upswing. The traditional quantitative approach is also flawed given macro’s inherently complex & intertwined nature. The typical multiple regression approach does not work when:
- All the macro factors like growth, inflation, real rates etc are all correlated. Given most macro factors are interrelated, multicollinearity means the beta estimates of standard multiple regression are invalid.
- Non-stationarity. Given several macro factors tend to trend for significant periods of time, it is common to derive a misleading good fit. Otherwise known as ‘spurious correlation’.
Qi employs a proprietary version of Principal Component Analysis. The advantage of PCA is dimensionality reduction: it takes a large universe of inter-related factors & breaks them down into a small number of orthogonal relationships.
A critical drawback with PCA in financial markets is the interpretability of the principal components. Markets like narratives but assigning a narrative to PC1 can be hard when factors & factor loadings switch. Instead, Qi adopts a different approach where we focus instead on the individual factors within each PC.
We choose a macro factor (for example inflation) & then shift that factor higher by 1 daily standard deviation. Given the weight on inflation within each PC & given the regression beta estimates, shifting inflation higher within PC1, PC2 & PC3 will have some total impact on the asset. By definition, this is the impact on the asset of a shift higher in inflation, holding all other factors constant. This is the Qi sensitivity measure.
It is these sensitivity measures we use to help try & answer the million Dollar question – which equity markets see rising real yields as a boon, an indicator of a healthy economic upswing? And which see them as tightening financial conditions & therefore a negative for future performance?
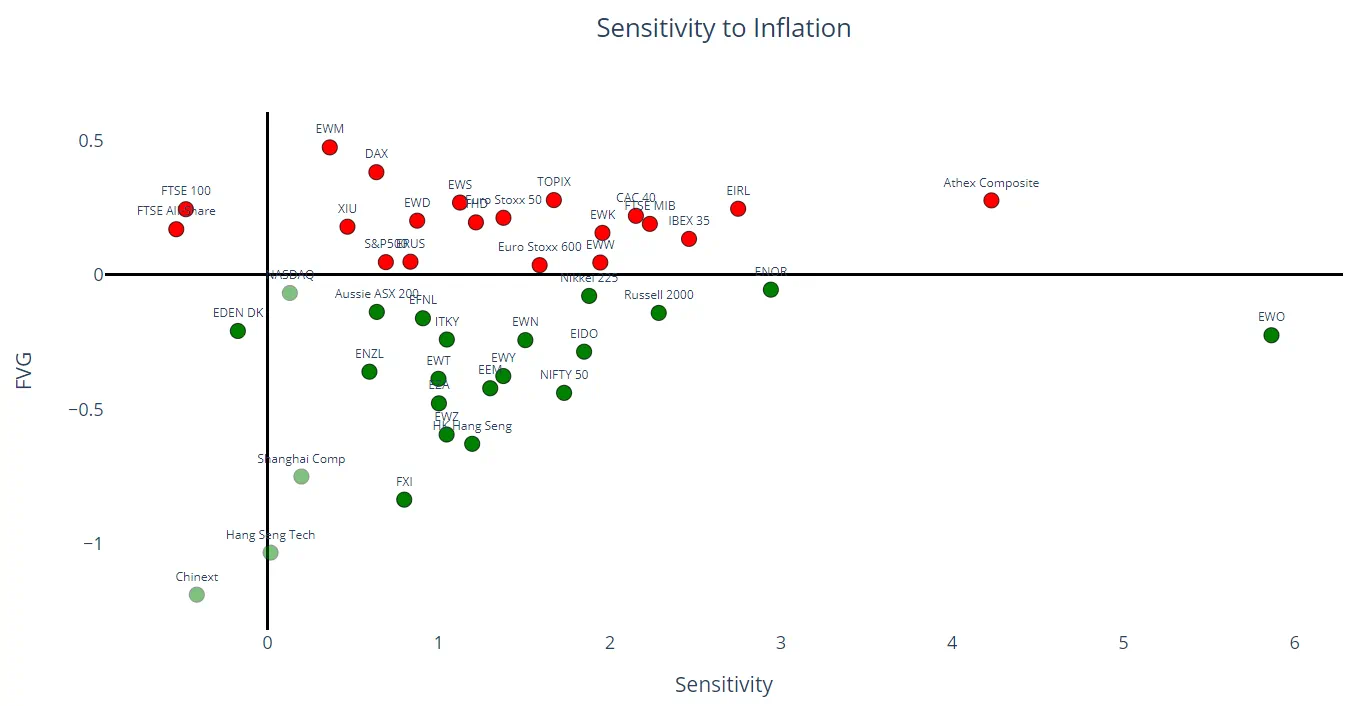
The two charts below offer similar analysis using Qi factor sensitivity metrics. The first takes a universe of sovereign equity indices from around the globe & starts by screening for sensitivity to inflation expectations (as measured by the inflation swap market). This factor sensitivity is shown on the horizontal axis &, unsurprisingly, nearly all equities show a positive relationship with inflation. Reflation is clearly deemed a good thing.
The standout is EWO – iShares MSCI Austria – which is, by some margin, the market with the strongest positive sensitivity. Rising inflation expectations benefits Austria above all its peers.
The colour of the dots speaks to macro valuation which is captured by Qi’s Fair Value Gap output – the difference between macro warranted fair value & the spot price. Red dots above the zero bound are rich to macro model value; green below are cheap. Greek equities are the next most sensitive equity market. They too benefit from rising inflation expectations, but they are already slightly rich.
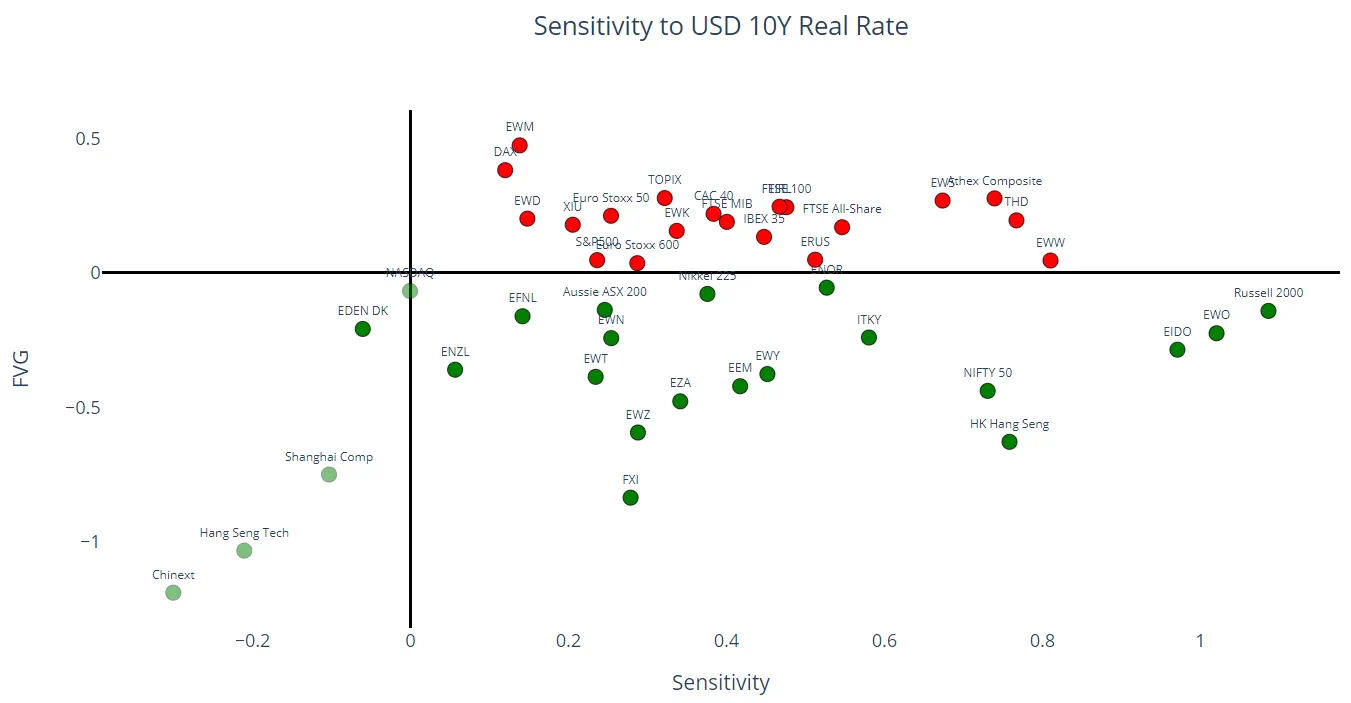
Then we repeat the exercise – using the same equity universe only this time we screen for sensitivity to US real rates (10y TIPS yields). Overwhelmingly, equities show a positive sensitivity to real yields – markets are generally taking the optimistic view that higher real rates reflect a healthy economic upswing.
But there is a fair degree of dispersion.
Of those with the greatest sensitivity, Russell 2000, Austria EWO & Indonesia EIDO are the three equity markets that are cheap to macro. The Hang Seng & NIFTY 50 offer a slightly better entry level (they are slightly cheaper versus model fair value) but sensitivity is slightly less.
Thailand THD, Singapore EWS, Mexico EWW & Greece are also beneficiaries from rising US real rates; but all start with a slightly rich valuation.
In two quick & easy steps Qi uncovers the equity markets that are best placed to perform should inflation trend high still; & those that are comfortable with rising real yields.
Two opposing views. That the Fed deliberately positioning themselves behind the inflation curve will inevitably result in a reflationary boom; or rising real yields will tighten financial conditions & prompt “risk off”. Whichever camp you fall into, Qi’s unique quantitative analysis provides a clear roadmap to the optimal trade expression.
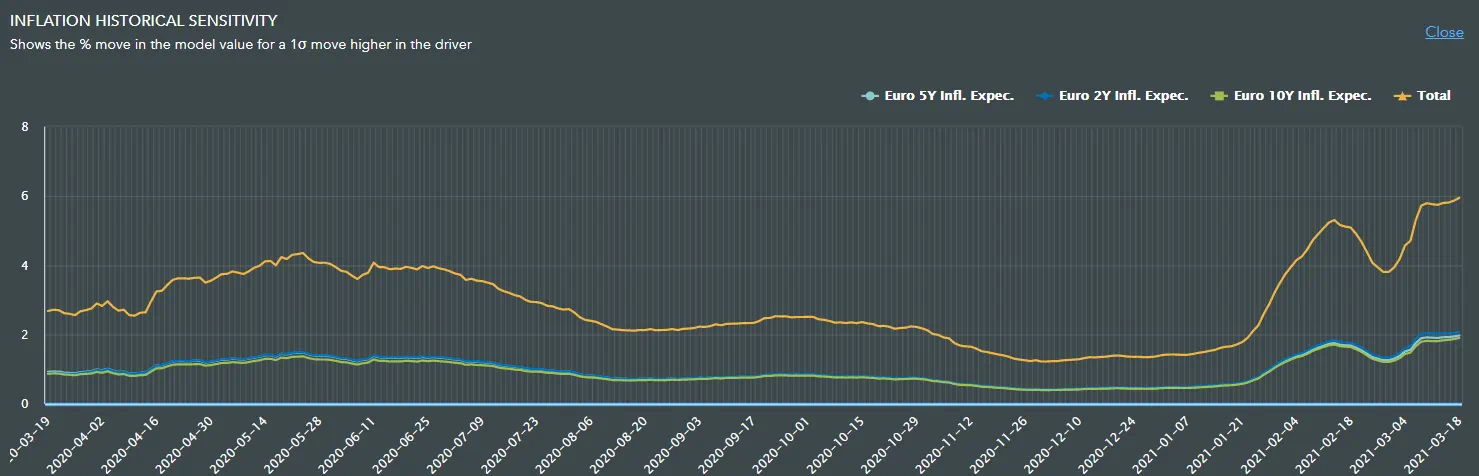
Currently, Austrian equities emerge as a winner under both scenarios. The chart below shows the sensitivity to inflation over the last year. The relationship has always been positive but, at the end of Jan, Austrian equities experienced a sharp increase in sensitivity.
These independent factor sensitivities allow Qi to identify changes in factor leadership; or, in macro terminology, a regime shift. In this instance we have observed key factor leadership amongst global equity indices. This analysis can be replicated across asset classes & across a wide range of macro factors.
Which FX crosses are most sensitive to risk aversion & a sharp spike in VIX? Traditionally the Japanese Yen is seen as a safe haven play, but a new macro regime is emerging & it is the Dollar that is the defensive asset currently.
Which part of the yield curve is impacted the most by a large move in crude oil prices? Qi demonstrates that ultra-long bonds (WN futures contract) has the greatest sensitivity to moves in Brent.
Given the great equity rotation trade unfolding, what is the macro anatomy of different US sectors. Is a simple growth versus value breakdown sufficient, or do the different macro drivers of different sectors tell a separate story?
Did you find this useful? Get our EPFR Insights delivered to your inbox.


