Four months after the Covid-19 pandemic swept across the world, China imposed a new national security law on Hong Kong.
The city, long a British colony, was returned to Chinese control as a special administrative region (SAR) in 1997 under an agreement that recognized – for a 50-year period – Hong Kong’s established capitalist system, the independence of its judiciary and many of the individual freedoms common in liberal democracies.
Critics of the new national security law imposed in 2020 say that it undermines this ‘one country, two systems’ arrangement. These largely Western critics also argue that, by bringing the judiciary and sources of information into line with Chinese norms, Hong Kong’s standing as a major financial center will be eroded.
Two years on, what impact has the changing political dynamics had on Hong Kong? EPFR’s data sheds some light.
Singapore as control
If you think of the evolution of Hong Kong’s equity market as an experiment, then Singapore is a natural control. Singapore is also a small Asian city-state with a history of British colonial rule and an open, market-driven economy. But it is self-governed.
We can get a sense of the evolution of equity markets in Hong Kong and Singapore by looking at the asset-weighted returns of all equity funds focused on each of these markets. The chart below shows compounded monthly equity returns for both from July 1997 to the present. We chose the beginning of 3Q97 as our starting point because the formal transfer of sovereignty over Hong Kong to China took place on the first day of that quarter.
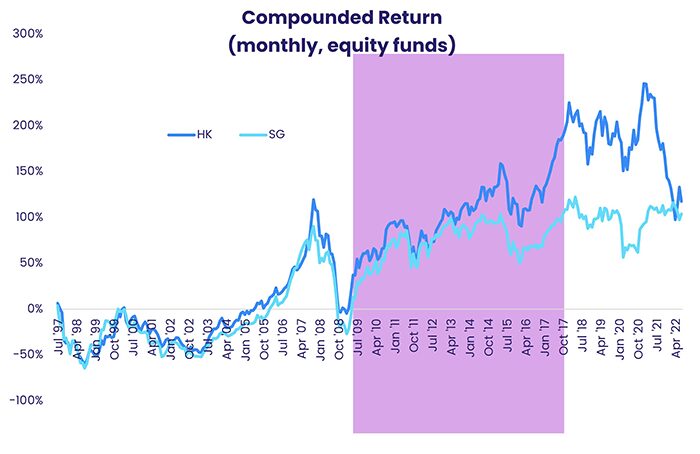
As the chart above illustrates, there are three distinct phases in the evolution of those asset-weighted returns. In the first, from 1997 to 2013, equity returns in the two markets track each other, confirming our choice of Singapore as a control.
In the second phase, starting in 2013, shaded pink in the chart, Hong Kong pulls away as the so-called Stock Connect with the two major mainland equity markets, Shenzhen and Shanghai, that was proposed in 2013 came into effect during 4Q14.
From the end of 2020, however, Hong Kong gave back all of its gains vis-à-vis Singapore.
Is China the cause, effect or both?
Given that Hong Kong is still broadly viewed as a separate market, with diversified fund groups assigning the SAR its own weighting, how much impact has China’s assertion of its authority really had on Hong Kong?
To address that question, we looked at asset-weighted equity returns for all of the various geographic foci tracked by EPFR. These are fund categories based on where funds invest, geographically. Many are country related, such as Germany funds or Singapore funds. Others are regionally focused, such as Latin America, EMEA or Asia ex Japan Funds. Still others are global, such as Global Emerging Market funds or Global-ex U.S. funds.
As a result of this clearly defined categorization, it is easy for us to asset-weight the monthly returns of relevant equity funds to isolate the return to each geographic focus. There were 71 such groupings, including China, Hong Kong and Singapore, that had non-zero returns for each of the 24 months to July 2022.
Each of these 71 geo-foci can be represented as a point in a 24-dimensional space, one for each month of returns. We can choose a set of axes for this space so that the first axis captures the most variation, the second – orthogonal to the first – captures the next most, the third, orthogonal to the first and second, captures the third-most, and so on.
For purposes of visualization we collapse this 24-dimensional space into the top two axes, or principal components, capturing the bulk of the variation, as seen below.
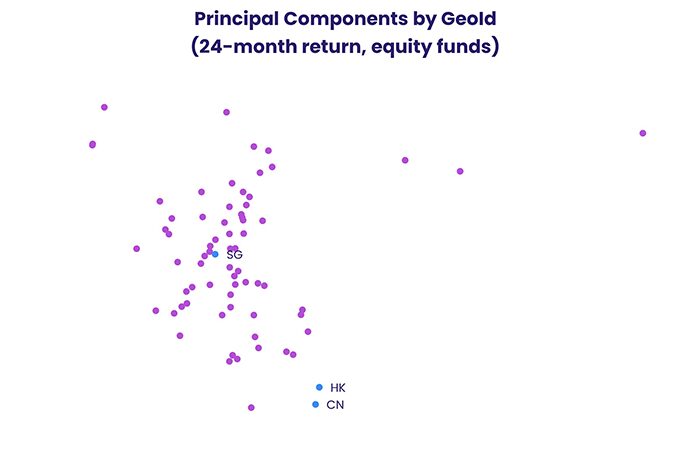
The points representing China, Hong Kong and Singapore are plotted in green, while all the others are pink. Russian President Vladimir Putin might assert “Ukraine is Russia!” That remains to be seen. What is clear from the graph, at least for equity markets, is that markets see one market, one system when they look at Hong Kong.
Investors taking a contrarian approach
Looking at flows into dedicated Hong Kong and Singapore Funds, it appears that investors weighing their exposure to these two markets have not been chasing returns. Quite the opposite.
The chart below shows total flows for these countries, scaled by total assets and compounded.
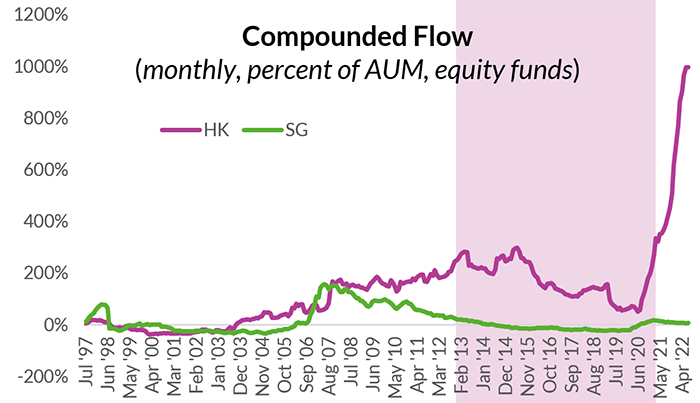
As seen in the chart, during the second phase when Hong Kong’s returns pulled away from Singapore’s, relatively speaking, money flowed out of Hong Kong. Then, since 2020, when pandemic-related restrictions helped to crater Hong Kong’s returns, money flowed back in.
Do investors know something we don’t? Or are they simply misreading the economic tea leaves? Only time will tell.
Did you find this useful? Get our EPFR Insights delivered to your inbox.


