This week, our resident Quant, Sayad Baronyan, looks at the impact the global economic environment is having on factor driven strategies & different asset classes…
Since the start of 2019, inconclusive US-China trade talks, uncertainty around Brexit, softening German economic data and worries about emerging markets led investors to be more cautious and selective. FOMC, in its last meeting, responded to these latest developments and came up with a much more dovish stance than expected. This, in turn, has led investors to expect fewer rate hikes from the Federal reserve going forward. Currently, FED futures are implying there will be no hikes in 2019. In this environment, we are witnessing divergence in flows between classical asset classes and geographies. For example, equities globally have seen a 29 billion US$ of outflow vs bonds which has seen an inflow of 55 billion US$ year-to-date according to EPFR data. On the contrary, Emerging markets equities has seen inflows of 17 billion US$ year to date. One should not take this EM flows as a given, as the increased uncertainty has led to daily swings in risk appetite towards EM equities among investors. 3 month rolling flow (%) volatility of EM Equity funds is at its highest since September (See Fig-1). In the week ending on February 27th the redemptions from China Equity Funds were the biggest we have seen since 3Q15.
In recent years, as investors have increased their allocations to quantitative strategies, another important question would be whether a similar divergence phenomenon is also taking place in factor-based investments?
To answer this question, we have gathered flows for two popular investment strategies: Momentum and Low Volatility using EPFR database. We have narrowed down our search to US mandated funds to ignore geographic divergences. As of 27/2/2019, our subset of low volatility funds includes 32 funds and total AuM is around 40 billion US$. Our subset of momentum funds includes 10 funds and a total AuM around 9 billion US$. Note that we only selected funds that have specifically stated a well-known low volatility or momentum index as their benchmark (see Fig-2). Flows to US mandated momentum funds has stalled since March-2018. Looking at flows as a percentage of total AuM to these two investment strategies, momentum funds had a relatively increased interest until mid- 2018. After this period flows started loose pace. This coincided with the start of the decrease in US Philadelphia Fed’s Manufacturing Index (See Fig-3). The rise in uncertainty and an expectation of an increase in volatility increased interest towards low volatility strategies starting from September 2018. In this period, the number of expected FED rate hikes in 2019 implied by the FED Fund Rate Futures has decreased down to zero (See Fig-4).
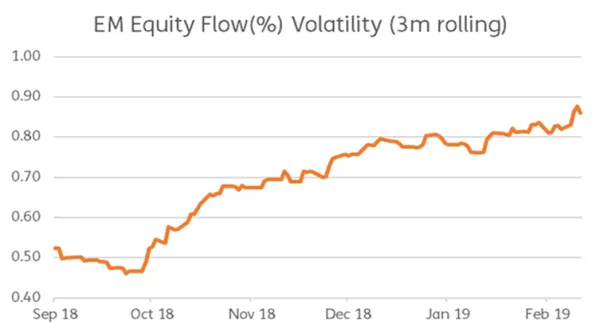
Figure 1 : 3 month rolling volatility of EM Equity Flows as % of AuM
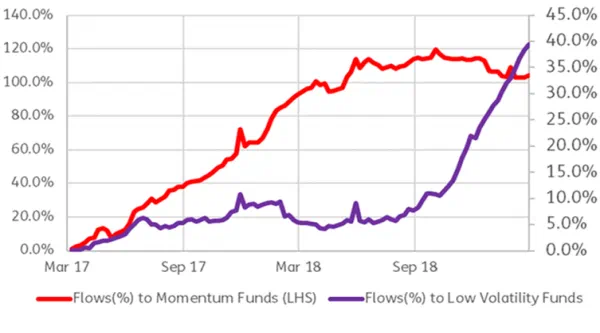
Figure 2 : Flows(%) to Momentum Funds vs Flows(%) to Low Volatility Funds
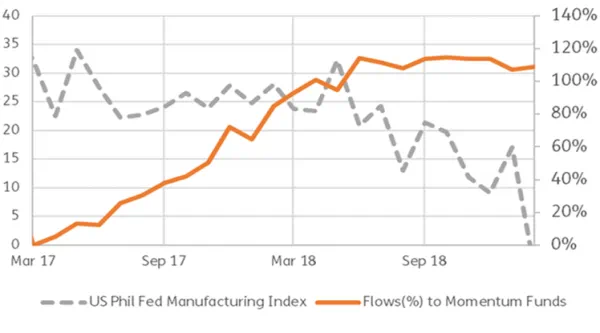
Figure 3 : Flows(%) to Momentum Funds vs US Philadelphia Fed’s Manufacturing Index
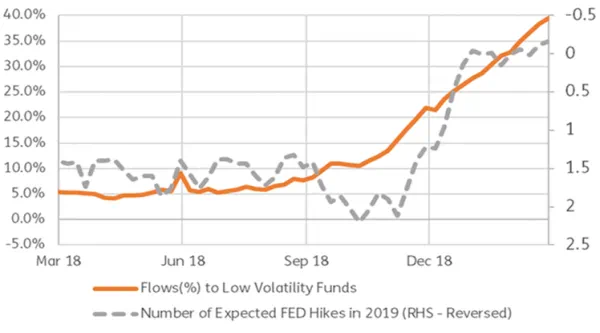
Figure 4 : Flows(%) to Low Volatility Funds vs Number of Expected Rate Hikes in 2019
Did you find this useful? Get our EPFR Insights delivered to your inbox.


