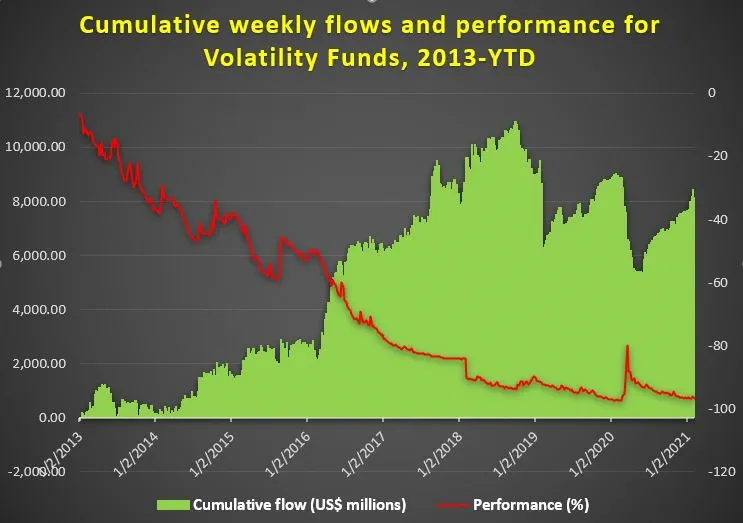
It feels like a long time, but it was only three years ago when the VIX index, the benchmark for measuring market volatility, hit an all-time intraday low of 8.56. Although CBOE noted that it was a glitch, and November 27, 2017 ended with the VIX well above 9, it highlighted the degree to which volatility had gone AWOL. That was reinforced six days later when the historical realized volatility of the S&P 500 index recorded its all-time low of 6.87.
Although investors were slow to accept the fact, as the chart below shows, volatility had by then been declining for the better part of a decade in the face of massive quantitative easing spearheaded by the US Federal Reserve, European Central Bank and Bank of Japan. This involved the provision of enormous liquidity, slashing interest rates to zero – or below – and the consistent issuance of strong verbal forward guidance aimed at suppressing volatility.
Because volatility is a very important input in most of the traditional models for asset pricing and portfolio construction, this has created significant questions and challenges for investors and money managers.
In this blog we look at two of these questions. First, is volatility returning? Second, if it is, what is the best way to measure it?
You can’t keep a good metric down
To address the first question, we start with an existing multi-asset model built by EPFR’s quant team.
The idea behind this model is simple: on a weekly basis the flows to each asset class are calculated and then ranked in terms of their normalized flows by quintile (see Figure 1 below). The higher-ranking asset classes are then put on a long basket, and the lower ranking ones put on a short basket. Since 2007, a period that includes the great financial crisis and the current pandemic, this model has generated a Sharpe ratio 0.6 and a per-annum return of 4.8%.
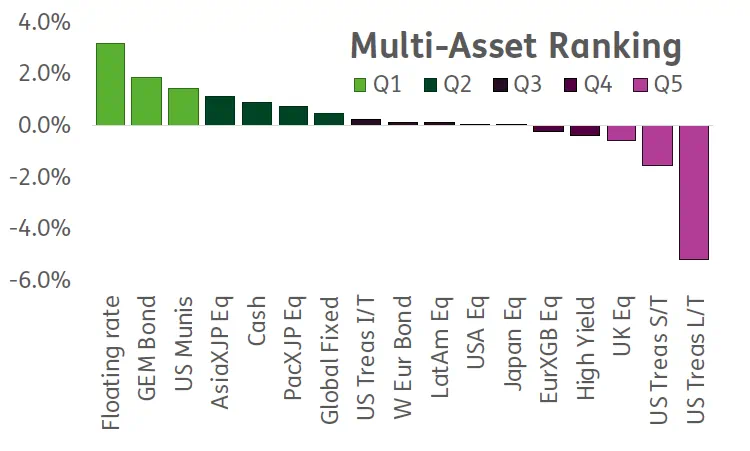
Figure 1: EPFR Multi Asset Model
In addition to its sustained outperformance, this model provides useful information regarding the market’s evolution over the past 14 years and the low volatility, low interest rate and high liquidity policy environment that helped shape that evolution.
One thing we have observed is that, as price volatility declined, so did the dispersion of flow among different asset classes. To build on that insight, we plotted the cross-sectional standard deviation of flows, averaged over a rolling year period, to create a measurement of the rotation speed between asset classes. This, we believe, is an excellent metric to measure implied volatility.
As Figure 2 illustrates, this rotation speed across asset classes decreased significantly from the Great Financial Crisis until the ‘taper tantrum’ in May 2013. After the taper tantrum died down, the rotation speed was almost stable until 2018.
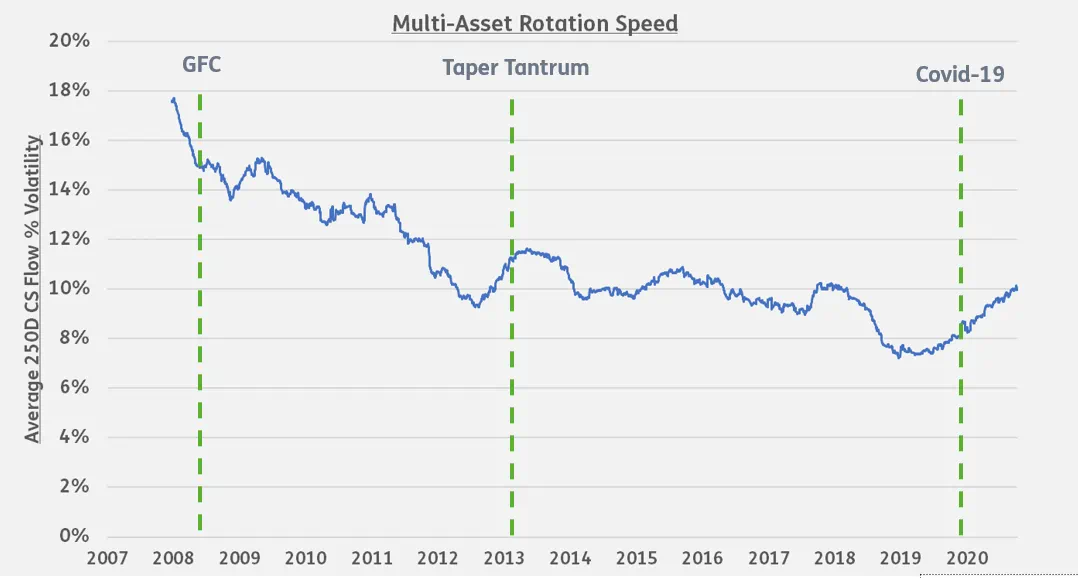
Figure 2: Multi-Asset Rotation Speed
This time is different
Since late 2018 we have seen the speed of this rotation increase steadily, with the pandemic that started in 1Q20 providing another tailwind for this shift.
One key difference this time around is that, although the central banks are again throwing nearly everything in their toolbox at the pandemic-induced recessions, the rotation speed has continued to accelerate.
Inflation, which has been as subdued as volatility over the past decade, is also a factor as the combination of pent-up consumer demand, supply and transportation constraints, protectionist policymaking in many countries and the latest rounds of stimulus boost inflationary expectations. As Figure 3 shows, there is a clear correlation between the rising term premium in response to these expectations and the rotation speed.
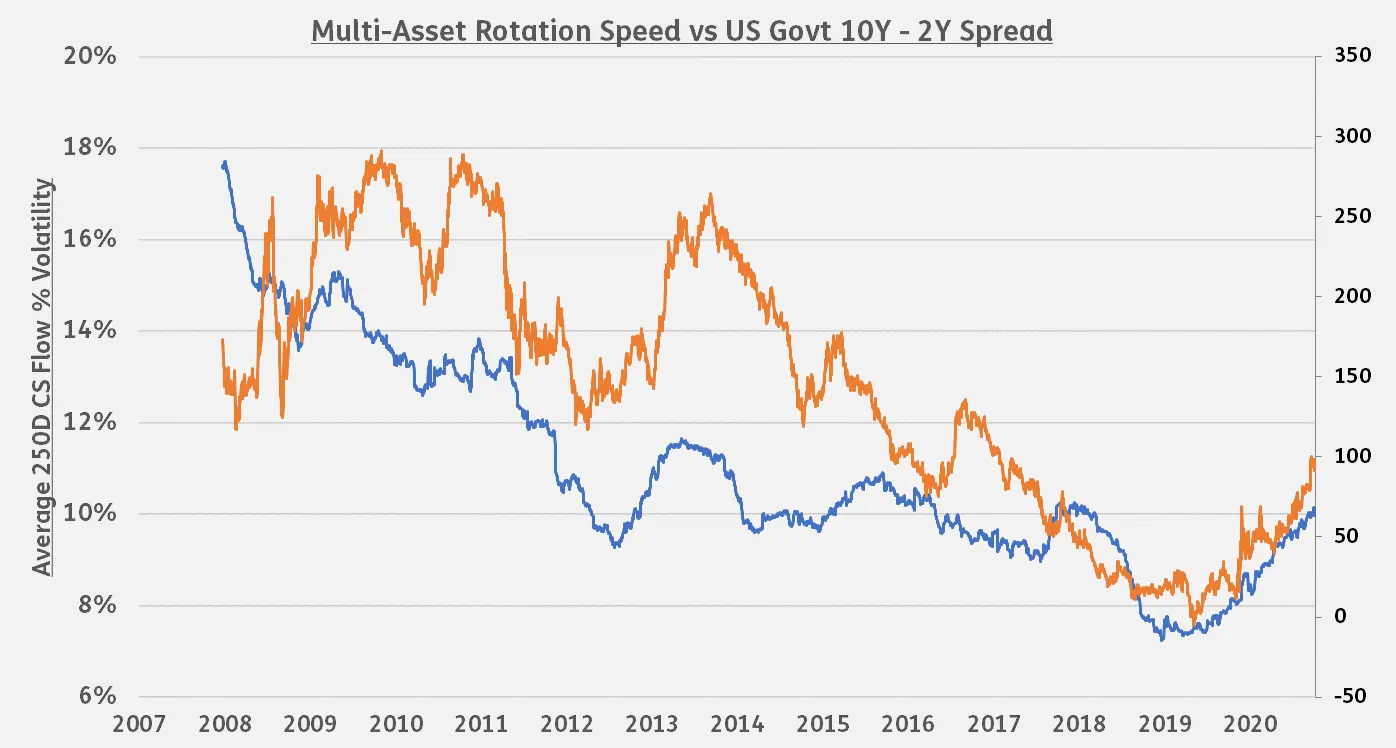
Figure 3: Rotation Speed vs US Term Premium
Where does this lead us?
Investors are certainly getting the message. Year-to-date, the increase in long-term rates and inflation expectations has helped boost flows to funds that track the VIX index (i), with a net US$1 billion flowing into them during the first five weeks of 2021.
It may be too early to discount the ability of central banks to wrestle volatility back into its cage. But, with the rotation speed within both multi-asset funds and sectoral funds on the rise, it looks increasingly likely we will see higher levels of volatility this year than markets have become accustomed to.
Furthermore, responding to it may be complicated by the longer-term impact of quantitative easing on asset prices and other historic market signals. In future blogs, we will look at the metrics and factors needed to gauge and interpret the ‘new normal’ for market volatility.
References
We sum the funds flows that have the following benchmarks:
S&P 500 VIX Mid-Term Futures Inverse, CBOE Dynamic Long VIX FuturesCBOE VIX Tail Hedge, Dynamic Short VIX Futures, S&P 500 Dynamic VIX Futures Total Return, S&P 500 Mid-Term VIX Futures, S&P 500 VIX 2-Month Futures, S&P 500 VIX 2-Month Futures (-100%), S&P 500 VIX Futures Enhanced Roll, S&P 500 VIX Futures Short Volatility Hedged, S&P 500 VIX Futures Tail Risk, S&P 500 VIX Futures Term-Structure Excess Return, S&P 500 VIX Futures Variable Long/Short, S&P 500 VIX Mid-Term Futures, S&P 500 VIX Mid-Term Futures (-100%), S&P 500 VIX Mid-Term Futures (2X), S&P 500 VIX Short-Term Futures, S&P 500 VIX Short-Term Futures (-100%), S&P 500 VIX Short-Term Futures 2x, S&P 500 VIX Short-Term Futures Inverse. If a fund is tracking with an inverse mandate, the flows to that fund is multiplied by (-1).
Did you find this useful? Get our EPFR Insights delivered to your inbox.


