I have always been at a loss to understand why the phrase “old wine in new bottles” is pejorative. After all, if you think about it, you really do want your wine to be old and your bottles new. While on the subject, it is apropos that I bring up the EPFR Regional Strategy, our oldest running quantitative strategy.
This strategy uses flows into actively managed mutual and exchange-traded funds to predict global equity market movements. Apart from the US, UK and Japan, it invests in Latin America, Europe ex-UK, Asia ex-Japan and Pacific ex-Japan.
This article reveals how the four-week flow, scaled by beginning-of-period assets, can predict which of these regions will outperform. The Regional Strategy first ranks the seven regions into five buckets (the second and fourth buckets have two regions each) and then goes long and short the regions in the highest-flow and lowest-flow buckets, respectively. As will be shown in the article, this strategy has, historically, proven quite profitable.
Flows
EPFR tracks flows, beginning-of-period and end-of-period assets, and fund return for individual mutual and exchange-traded funds on a daily, weekly and monthly basis.
Daily and weekly coverage, by assets under management, was $33 trillion as of March 2, 2022, whereas monthly coverage for February stood at $52 trillion. Daily and weekly data is released the following day around 5 pm EST, while monthly data has a T+16 lag. The Regional Strategy uses daily/weekly data due to their timeliness.
Classifications
EPFR classifies funds by several characteristics. For the operation of the Regional Strategy, only some of these characteristics matter. One is where a fund focuses its investments, geographically. EPFR refers to this as a fund’s geo-focus. Another is whether a fund is actively managed or follows an index. A third is the type of fund, whether equity, bond, balanced, money-market or alternative.
The Regional Strategy uses data on actively managed equity funds only. Further, these funds must belong to the following geo-foci, namely US, UK, Japan, Latin America, Europe ex-UK, Asia ex-Japan and Pacific funds. This last category consists of funds devoted to developed Pacific countries other than Japan (e.g. Australia, New Zealand, Singapore, etc.) clubbed together with Pacific Regional funds.
The rest of this article will look at flows and starting assets of active equity funds aggregated up within each of these seven regions.
Indicator
The Regional Strategy uses flows and beginning-of-period assets of active equity funds aggregated up to the regional level. Chart 1 shows aggregate flows into and starting assets of funds in each region for the week ending Nov. 17, 2021.
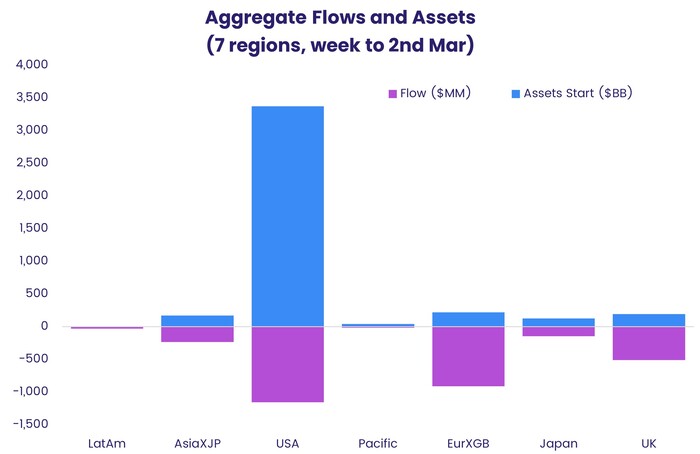
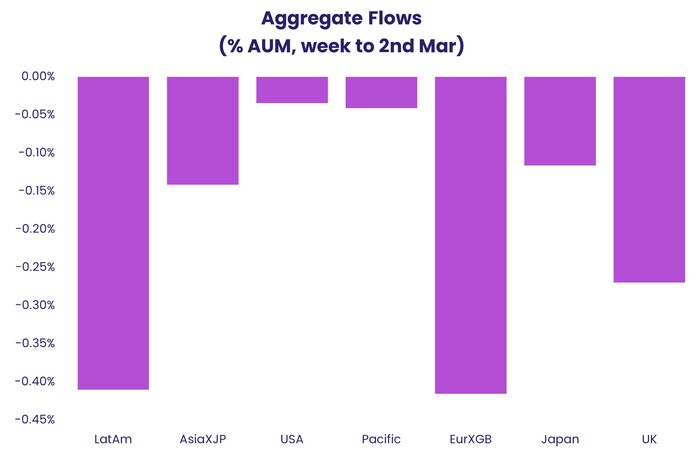
Chart 1 highlights that the U.S. is on a different scale than any of the other regions. For this reason, we normalize flows by expressing them as a percentage of starting assets.
Finally, for each region, to smooth out the signal, these percentage flows are compounded together with those for the prior three weeks to yield four-week percentage flow.
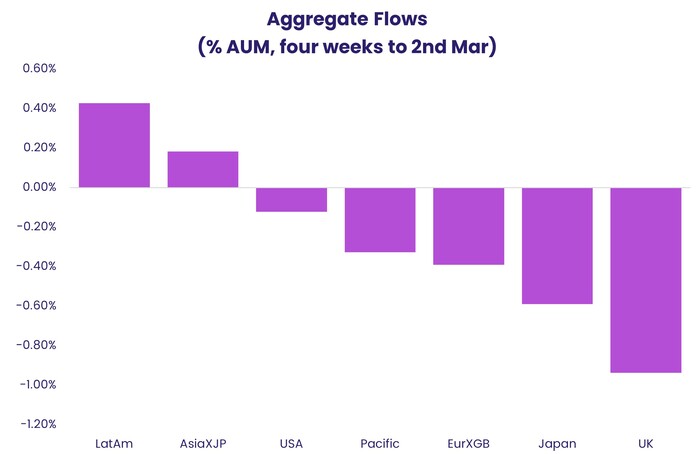
As you can see in Chart 3, the model expects Latin America to outperform the United Kingdom.
Strategy
Here is the basic methodology for the strategy. At the end of each week, compute four-week flow — for each region — as outlined above. Rank the seven regions into five buckets on the indicator so that quintile one has the region with the highest flow, as a percentage of assets, and quintile five the lowest. Quintiles two and four will end up having two regions. Simply go long the region in quintile one and short that in quintile five. Hold the position for a week. Wash, rinse and repeat.
Weekly flow data will be available Thursdays, just after market close. Accordingly, you will need to trade the strategy sometime on Friday.
Performance
The strategy was operated in the manner outlined above every week from June 8, 2007, through Dec. 18, 2020.
Each of the regions traded corresponds to an MSCI index and the index returns (total, net dividend) were used as a proxy for each region’s performance.
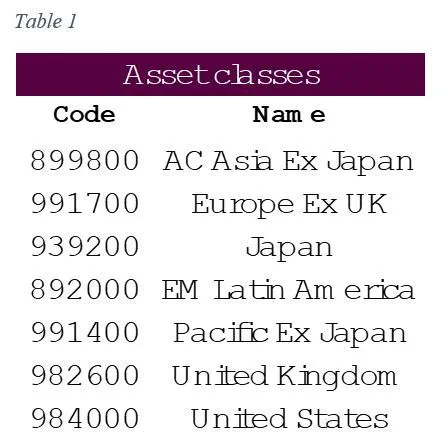
Table 2 shows annualized returns to each of the buckets, in excess of that of an equal-weight portfolio of each of the seven regions. The panel “Q1 ex Q5” shows the return and Sharpe of the high-flow bucket over the low-flow bucket.
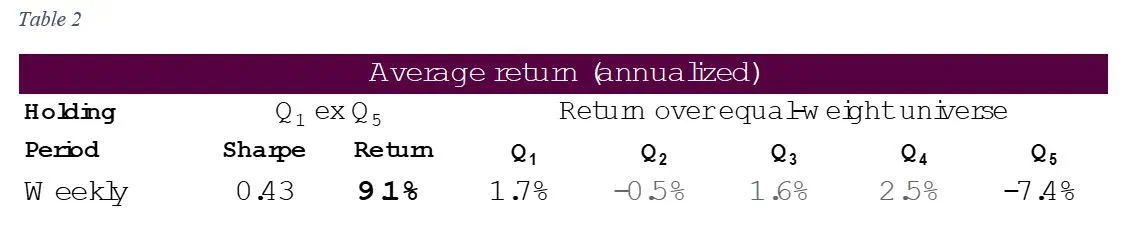
As you can see from the table, the Regional Strategy has been quite profitable over time.
Conclusion
As detailed in this article, our Regional Strategy proves to be an EPFR strategy that is “old wine in a new bottle”. We have discovered a new, valuable approach to one of EPFR’s oldest strategies. The methodology outlined here provides a profitable ability to predict global equity market movements and foresee which regions will outperform. EPFR Fund Flows Data and the application of our Regional Strategy utilizing actively managed funds allows you to gain a competitive edge in the market.
Did you find this useful? Get our EPFR Insights delivered to your inbox.


