Balanced Funds, also known as hybrid or multi-asset funds, are a class of funds that contain both a debt and equity within a single portfolio. These funds offer investors diversified exposure that can be adjusted over time — either on a discretionary basis or in response to predetermined markers — and are an important tool for target-date retirement planning.
In addition to Balanced Funds, EPFR collects data on another major multi-asset group, Total Return Bond Funds. But, in both cases, quantitative analysis has largely bypassed the multi-asset universe in favor of the deeper, more granular pool of data surrounding Equity Funds and their allocations.
In this blog, we will take a first look at the risk-return profile for Balanced Funds, the more conservative of the two groups and explore the added value of a simple switch strategy using Balanced Funds in conjunction with Equity and Bond Funds.
The tools at hand
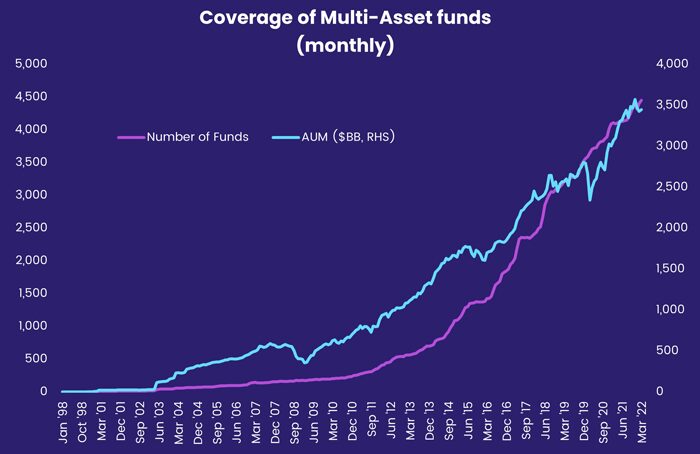
EPFR covers some 4,300 Balanced Funds that manage $3.5 trillion worth of assets. That pool of assets has increased by over $500 billion since the beginning of 2021. Coverage of Total Return Funds encompasses 410 funds with over US$1 trillion in AUM.
The chart below shows the number of Balanced Funds (pink line, left hand scale) covered by EPFR and the cumulative growth of their assets under management (green line, right hand scale in US$ millions). Growth in both categories accelerated in the wake of the Great Financial Crisis (GFC) of 2008-09.
Classifications
EPFR classifies funds by several characteristics. For the operation of the Regional Strategy, only some of these characteristics matter. One is where a fund focuses its investments, geographically. EPFR refers to this as a fund’s geo-focus. Another is whether a fund is actively managed or follows an index. A third is the type of fund, whether equity, bond, balanced, money-market or alternative.
The Regional Strategy uses data on actively managed equity funds only. Further, these funds must belong to the following geo-foci, namely US, UK, Japan, Latin America, Europe ex-UK, Asia ex-Japan and Pacific funds. This last category consists of funds devoted to developed Pacific countries other than Japan (e.g. Australia, New Zealand, Singapore, etc.) clubbed together with Pacific Regional funds.
The rest of this article will look at flows and starting assets of active equity funds aggregated up within each of these seven regions.
The rationale for these funds boils down to their ability to provide greater returns than Bond Funds with less risk to principal than Equity Funds. To start our analysis, we will take a look at how this middle-of-the-road promise holds up when viewed through the lenses of flow and returns.
Finding their niche
EPFR classifies the funds by their mandate: is a fund investing predominately in equities, bonds or some mixture of both? The answer determines which group and sub-groups a fund is placed in. The chart below shows flows into each of these three categories of funds, at their broadest level, with those flows expressed as a percentage of assets under management.
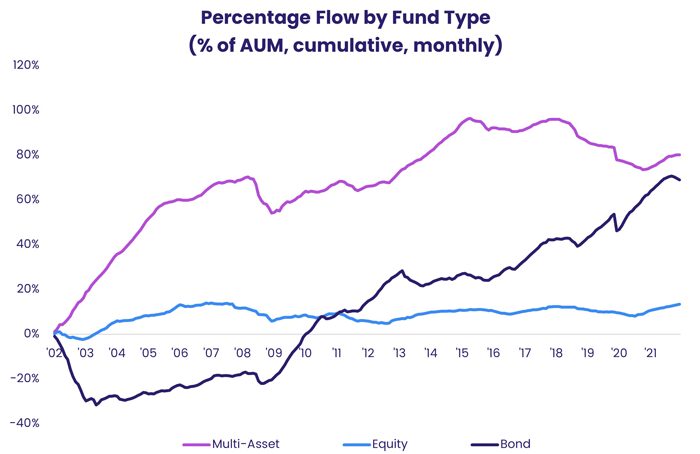
As you can see from the chart, Multi-Asset (Balanced) and Bond Funds have been steadily gaining assets over the past two decades while Equity Funds have marched in place.
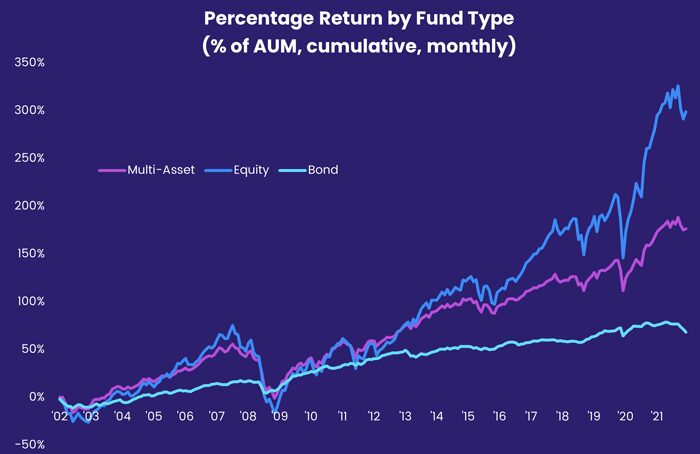
One can perform the same analysis with returns, rather than flows. The chart below shows weighted average monthly returns by fund type for Equity, Bond, and Balanced Funds. In this case, the return of multi-asset funds falls – by design — between those of bond and equity funds.
Getting to Beta – and beyond
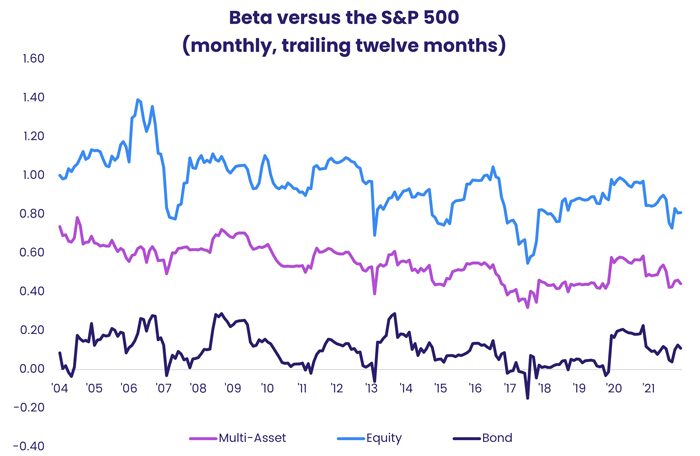
Looking at trailing 12-month beta versus the S&P 500, it is also clear that the multi-asset finds tracked by EPFR deliver on their promise of lower volatility than Equity Funds.
This raises an obvious question: how to get excess returns from a vehicle in the middle of the pack? To answer this question, we created a simple ‘switch’ strategy using the broadest groupings of Equity, Bond and Balanced Funds.
We tried to predict one-month forward return by looking at trailing return and flow over the prior quarter. For each asset class, for each month, we therefore had the following six predictors:
- Flow.m1 – percentage flow over the current month
- Returns.m1 – percentage return over the current month
- Flow.m2 – percentage flow over prior month
- Returns.m2 – percentage return over prior month
- Flow.m3 – percentage flow over the month before the prior
- Returns.m3 – percentage return over the month before the prior
All the returns and predictors were mean-adjusted so their average value, for any one period, across Equity, Bond and Balanced Funds, was precisely zero. This is done because we are trying, at each point in time, to find the best instrument to invest in. That is, rather than attempting to time the market, we are always 100% invested.
In conclusion
Running one big regression using these predictors, we found that returns for the current month (“Returns.m1”) and the one falling two months earlier (“Returns.m3”) appeared predictive. The only flow number that looked vaguely useful was the one with the most lag (“Flow.m3”).
We ran another regression using Returns.m1, Returns.m3 and Flow.m3. The results demonstrated that the flow predictor was essentially useless. One last final regression using just the two remaining return predictors show they work quite well independent of each other.
We display all these results in the table below. Factors are in bold where they appear predictive.
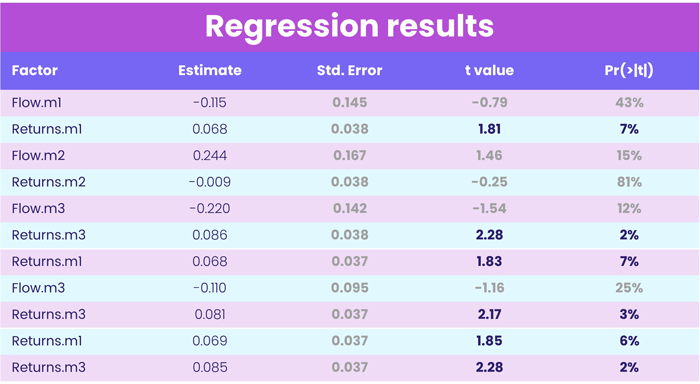
The encouraging thing about Returns.m3 being the best predictor is that, unlike Returns.m1, the returns are known at the time one would be trading. This is because EPFR’s monthly flow and returns data are reported in the middle of the following month. Returns from three months before the trading month, on the other hand, are known well in time. As such they can be used in a trading strategy.
Our first foray into Balanced Funds suggests that flows data, absent further research, cannot be used to predict forward returns. But a useful trading strategy that switches between Equity, Bond and Balanced Funds can be constructed using trailing returns.
Given the rapid growth in the number and AUM of multi-asset funds, further quantitative analysis of this universe is merited.
Did you find this useful? Get our EPFR Insights delivered to your inbox.


