As vaccination numbers around the world creep up, US consumers find themselves awash in cheap credit – and, in some cases, ‘helicopter money’ – and growth forecasts for some emerging markets are still in the 8-12% range, the case for cyclical stocks and sectors grows more compelling by the day.
On the other hand, the case for staying on the defensive can still be made. The spread of new Covid-19 variants has cast a shadow over the expected pace of the world’s recovery. Moreover, despite the closures in retail, services, and travel, and move to remote working over a year ago, the anticipated outperformance by defensive sectors such as Health Care and Consumer Staples never materialized. Cyclicals pushed above and beyond from mid-May 2020 onwards.
It appears there may be a ‘new normal’ developing for the interplay between these two classic groupings. Some cyclicals are certainly responding to triggers usually associated with a shift towards defensive plays.
This raises new questions for investors regarding the best strategies for timing rotations between these two sector groups. How best to sidestep a corrective drawdown in cyclicals without missing out on potential opportunities to generate alpha?
Capturing a momentum signal
In this Quants’ Corner, we will discuss how we can utilize EPFR’s daily fund flow and monthly sector and country allocations data to identify, and pre-empt, shifts in investor sentiment. This will allow us to make predictions about the future movement of cyclical and defensive sector groups.
Charts 1 and 2 below show us the cumulative daily flows into EPFR-tracked Equity Funds with cross-border mandates since 2008, grouped by their allocations to cyclical and defensive sectors in two – the US and Japan — of the six regions that our strategy is based on.
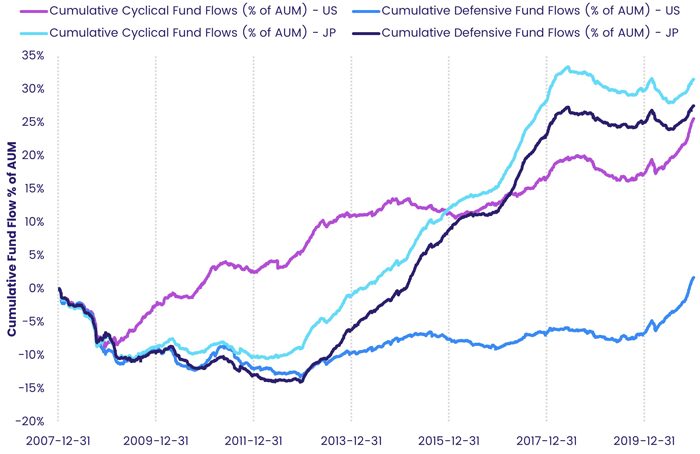
Chart 1 – Cumulative daily flows into Cyclical and Defensive sectors in the US and Japan from 2008.
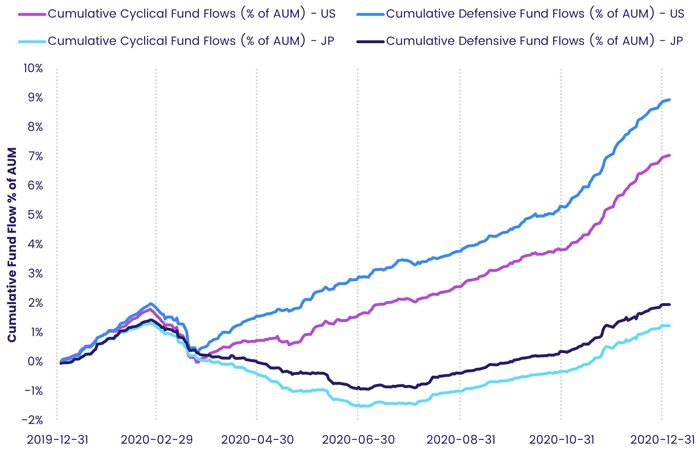
Chart 2 – Cumulative daily flows into cyclical and defensive sectors in the US and Japan in 2020.
As the charts illustrate, over the long term there is a clear preference for cyclical sectors. However, a surge in flows to defensives within both regions during 2020 reflects the impact of the Covid-19 pandemic on investor sentiment and markets.
To navigate the shifts between this long-term trend favoring cyclicals and the shorter periods when defensives are preferred, we built a Flow Momentum Indicator.
How we get there
To construct the Flow Momentum Indicator, we calculated the net to cyclical and defensive sectors in six regions and countries. Those are the US, Eurozone, EMs, Japan, the UK, and China. We do this by multiplying flows for each fund with a cross border mandate by the relevant country and sector allocations data. Then, after summing the flows and AUM across all applicable funds and dividing the results into cyclical or defensive sector groups, we compute the aggregate flows as a percentage of the total AUM.
Following the methodology laid out by Srimurthy et al., the daily flow percentage (Flow %) was compounded on a trailing 20-day period. Finally, these compounded series were back tested between 2008 and 2020 based on going long the sector groups with the higher Flow % (Q1) and short the remaining ones (Q2).
In Table 1, we report the annualized return difference between Q1 and Q2, and the associated annualized Sharpe ratios.
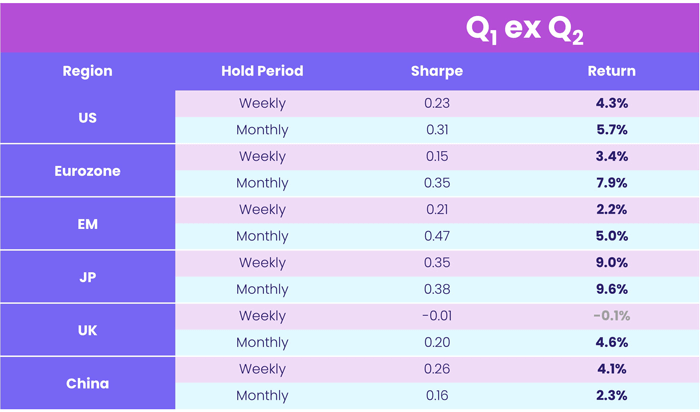
Table 1 – The annualized return and Sharpe results from the back tests on Flow % for regions US, Eurozone, EM, JP, UK and China.
We see that the strategy proved effective across all regions. The most notable results are (1) that Japan outperformed the other regions consistently across both rebalancing periods, followed by emerging markets, and (2) that the biggest return is achieved by rebalancing all of the regions except China on a monthly basis.
While the weekly results were patchier, Chart 3 illustrates that Japan and emerging markets produced excess returns in 2020 when rebalanced weekly despite the strong tilt towards defensive sectors.
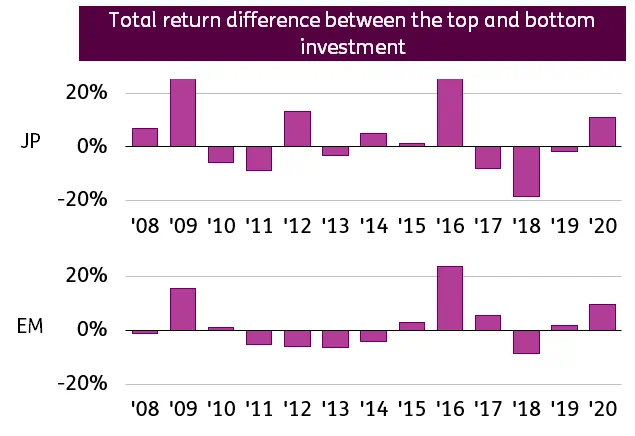
Chart 3 – The return profile for the back tests on Japan and EMs, using a weekly rebalancing.
Future refinements of this strategy may involve utilizing EPFR’s more granular industry level flows and allocations data. Stay tuned.
Did you find this useful? Get our EPFR Insights delivered to your inbox.


