Tracking global risk appetite using multi-asset fund flows
Over the last decade, as investment managers have increased their attempts to generate investment products that efficiently diversify, resulting in multi-asset balanced funds on the rise.
Multi-asset funds used to include just equities and bonds from an individual country when they were first introduced. At the time 60%:40% or 70%:30% portfolios were easy to explain to investors, as there were only two types of investments, but nowadays multi-asset funds are more complicated. Today, asset managers can use different geographies and asset classes to build strategies for multi-asset funds. A traditional multi-asset fund manager might easily include high yield corporate bonds as a new asset class to a multi-asset portfolio or add Japanese exposure with a few clicks on a screen. Overall investment strategies have spiraled in complexity and require a control mechanism.
Today, most of the asset managers are required to comply with a predefined budget while investing in different products, to limit their exposure to risky assets. These risk budgets are simply calculated using historical volatilities and investors can choose from a range of multi-asset funds with ‘low to high’ risk budgets attached.
As these investment vehicles are becoming more popular, their importance in tracking the global risk appetite is also increasing. Investors with a higher risk appetite will invest higher amounts in higher volatility targeting funds. As a result, there are higher investments in equities, high yield bonds, and emerging market assets. Investors with a lower risk appetite will invest in lower-risk budgeted funds, resulting in higher investments in short-term bonds and cash-like instruments.
Overall risk appetite of investors can be tracked through state-of-art methodology using EPFR data. Investors can track funds flows from high-risk multi-asset funds vs low-risk multi-asset funds, resulting in invaluable data insights and financial intelligence. In order to generate this analysis, first, we ranked balanced funds in the EPFR database into deciles using their three-year rolling standard deviations. Second, we calculated the cumulative flow (% of AuM) into the top quartile (funds with highest historical volatility) and into the bottom quartile (funds with lower historical volatility), see figure 1.
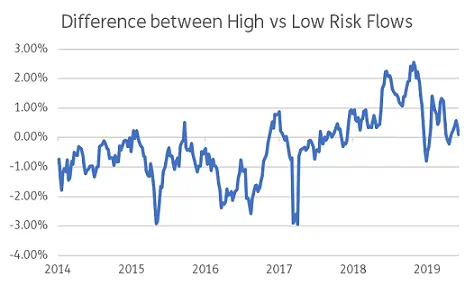
Figure 1: Difference between the cumulative flow (% of AuM) to funds with highest historical volatility and lowest historical volatility – 4-week rolling sum
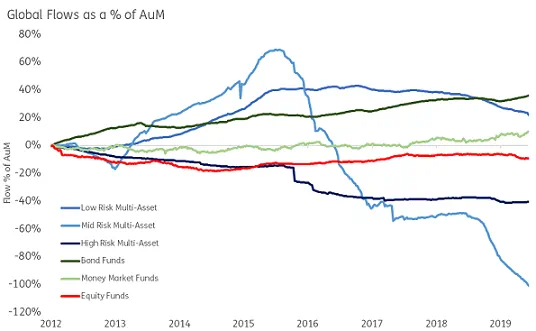
Figure 2: Fund Flows to different Risk Categories in Multi-Asset Funds and Classical Asset-Types
Figure 2 shows flows into low, mid, and high-risk multi-asset funds with the classical asset-types, equities, bonds, and money market funds. From the start of 2012, both low-risk and mid-risk funds tended to receive inflows whereas high-risk funds have received outflows. However, after the end of 2015 mid-risk funds started to receive outflows, and flows into low-risk funds also started to stall. Recently (from the beginning of the last quarter of 2018), low-risk and mid-risk funds started to receive increased outflows relative to their AuMs again. In the same period, money-market and bond funds started to see inflows – representing a significant shift in the global risk appetite.
Rapid changes in the investment atmosphere need tracking. The ability to investigate these changes using state-of-art technologies is crucial and with EPFR fund flows data you can help investors: generate different measures, and incorporate the changing investment universe, habits, and vehicles of investments available to investors.
Did you find this useful? Get our EPFR Insights delivered to your inbox.

