
Quants Corner – Saudi oil facility attack and fund flows
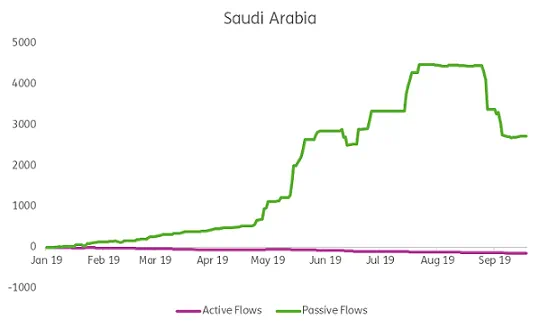
During the first quarter of this year officials from Tadawul, Saudi Arabia’s main stock exchange, told Reuters that they were anticipating...
Sayad Baronyan, Chief Innovation Officer, leads research and development efforts at EPFR. His team mines fund flows and positioning data, develops quantitative and qualitative research content, and creates analytics around EPFR’s datasets.
Before joining EPFR, Sayad headed the multi-asset funds desk at HSBC Global Asset Management in Istanbul, where he managed roughly $500 million of assets under management and a range of products in the multi-asset space. He leverages his portfolio management background to offer deeper insights to clients. He is also a Research Associate at the Financial Markets Group, London School of Economics.
Outside the office, Sayad, a native of Istanbul, is an avid football fan and a prolific reader of financial economics who devotes most of his time to his family.
MSc, Computational Science - Istanbul Technical University.
Ph.D, Finance - Özyeğin University (Istanbul).