A Quant fund and benchmark performance comparison
In my post ‘The global evolution of low volatility Investment in asset management’, we looked at the evolution of low-volatility funds within the last decade, through statistical analysis. This week, we will ‘deep dive’ into the performances of funds following low-volatility strategies.
As the name suggests, low-volatility funds deliver a lower volatility when compared to overall market volatility – hence the allocation of a higher weight-to-stocks, with a lower standard deviation of returns (historically). Contrary to classical finance literature, Black, Jensen and Scholes (1972) were first to report that stocks with lower volatility were generating higher returns. There have been several attempts to explain this anomaly since, including the leverage constraints of investors and behavioural gambling tendencies which lead to an increased demand of stocks with higher volatility, reducing their future returns.
After mounting evidence & a rise in Smart Beta strategies, asset management companies are increasing the use of low-volatility factors in their investment schemes. In addition, this increased interest suggests there are different kinds of low-volatility strategies in use from implementation to philosophy. These strategies include optimized methods such as ‘minimum variance or low-risk portfolios’ or more standard ranking methodologies like ‘high dividend yield’, ‘high quality’ or ‘low historical volatility’ portfolios.
Minimum variance strategies generally solve allocation optimization for the lowest portfolio volatility, whereas low historical volatility strategies weight stocks inversely with their historical standard deviations. The difference between these low-volatility strategies, is the approach to the problem, although even within a single kind of low-volatility strategy there are multi-implementation methodologies. The result is a plethora of different performances of funds and benchmarks available for investors.
Let’s take a look at the performances of low volatility funds, focusing on low-volatility strategies which either use minimum variance, low historical volatility or low total volatility. We will include strategies which are a combination of these factors with high dividend yield or high-quality factors to increase our scope.
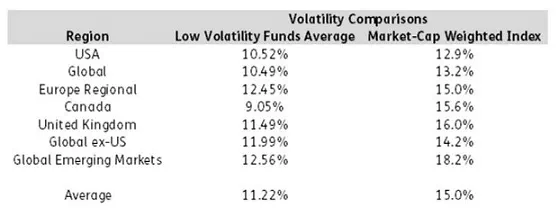
Chart 1: Comparison of Volatilities by Geographic focus between Low-Volatility Funds vs Market-cap Weighted indices in the last 5 years (May 2014 – May 2019). All returns are weekly and calculated in USD.
Chart 1 shows the average volatilities of Low-Volatility Funds vs Market-cap Weighted indices in the last 5 years (May 2014- May 2019). Low-volatility funds kept their promise in this period with a significantly lower volatility across different geographic mandates. The biggest volatility spread between low volatility funds and market cap-weighted index can be seen in Emerging Markets and Canada, whereas the lowest spread was in the USA.
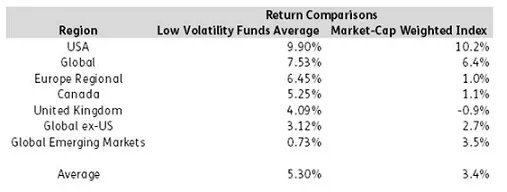
Chart 2: Comparison of Average Returns by Geographic focus between Low-Volatility Funds vs Market-cap Weighted indices in the last 5 years (May 2014- May 2019). All returns are weekly and calculated in USD.
Chart 2 highlights the low volatility anomaly as active during this period. Lower risk investments generated higher returns on average. In the USA, the spread between low volatility funds and market cap-weighted indices was marginal. The Emerging Markets showed a positive return on average, although this return was lower than the market cap-weighted index on average.
The growing interest towards Low-volatility strategies comes as no surprise, as in many regions have performed better than the classical benchmark indices in the last five years, and while delivering this performance they have kept their promise of having lower volatility. In an increasingly uncertain world, these types of funds are surely set to stay alive.
For more on Low-volatility investment, read our whitepaper, ‘The global evolution of low volatility investment in asset management’.
Did you find this useful? Get our EPFR Insights delivered to your inbox.