The overall sentiment in the Emerging markets was affected negatively by the latest round of trade tensions between US and China. The S&P500 Index is down more than 4.0% from its highest point this year, and last week investors pulled more than $1.1 billion from China, HK and Greater China equity funds, according to EPFR data. The continued escalation of trade war has raised further concerns on global growth, which impacts technology stocks. According to EPFR data, China technology sector funds experienced record setting outflows, and all FANG* stocks are down from their late-April highs.
The recent correction of FANG stocks has come as a surprise for some market participants. As one would expect, events like trade war are hard to predict. It is evident from these current events new developments can drastically change markets perception and affect prices in short time. In critical times like this it is important to differentiate between fundamental and non-fundamental moves, know the previous market positioning, be aware of the consensus view and have an idea of the number of participants sitting on that view. This might be decisive both for short-term and long-term success of the investment strategy.
According to the EPFR stock flows database, FANG stocks has received an estimated flow of 3.6 billion $USD in the last 3 months. The EPFR stock flows database currently tracks a total investment of 230 billion $USD in FANG stocks. Hence, this amount is currently around 1.5% of the total investments in these stocks tracked by EPFR database. Historically, this is the third biggest inflow in the last 5 years to FANG stocks in EPFR stock flows database (Figure 1).
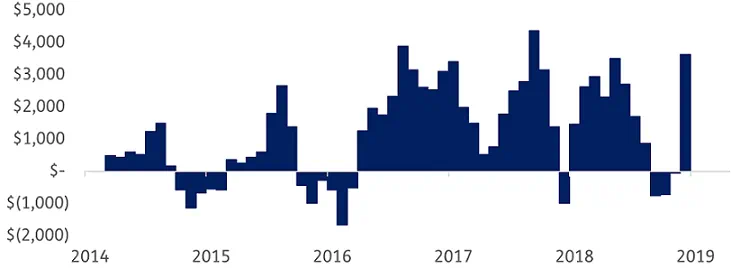
Figure 1: 3-month cumulative flows to FANG stocks.
Not all FANG stocks held the same amount of interest and positioning. The most commonly held stocks between FANG stocks was Google, according to EPFR Stock Flows database which includes both active and passive funds (Figure 2). In terms of non-US based ownership, Amazon had the highest statistics, with 21% of the total allocation in Amazon stocks derived from non-US domiciled active or passive funds. (Figure 3)
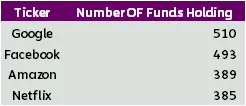
Figure 2: Number of funds holding stocks
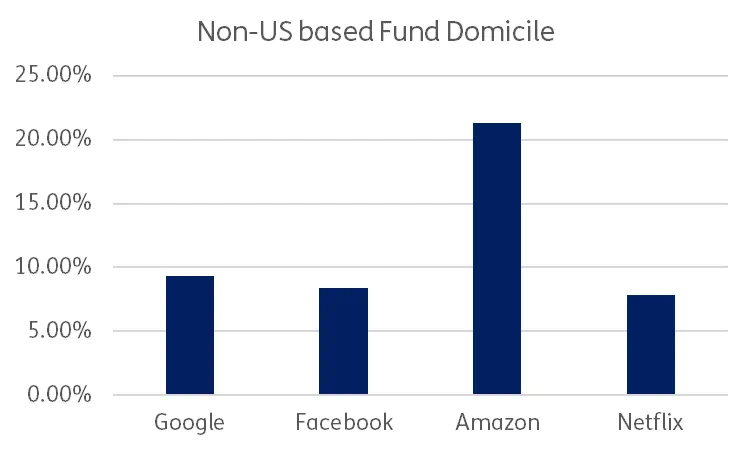
Figure 3: Percentage of ownership: non-US based fund domicile
Looking further in to the positioning, by end of April, FANG stocks on average had a higher weight in active funds compared to passive funds (Figure 4). Google had the highest spread between active and passive managers, whereas Amazon had the lowest spread. Looking at changes in active holdings in funds, Facebook had received the most interest recently. The number of active funds increasing weights more than 5% of their previous allocation in April to Facebook stocks, was higher than other FANG stocks. (Figure 5)
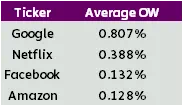
Figure 4 : Active fund weights – Passive fund weights
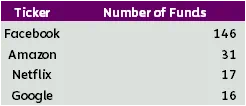
Figure 5: Number of active funds increasing weights more than %5 of their previous allocation
To understand non-fundamental price pressures on both sides, EPFR stock flows data can be used to generate further statistics on FANG stocks. The combination of holding/ ownership data and previous positioning with fund flows can provide additional insights. EPFR stock flows database can enhance the investment decision process, and improve risk management practices, check out our recent stock crowding webinar, for further more details.
*FANG is the acronym for Facebook Inc., Amazon.com Inc., Netflix Inc., and Google-parent Alphabet Inc.
Did you find this useful? Get our EPFR Insights delivered to your inbox.


