Steven Xinlei Shen
Steven Xinlei Shen, Director of Visualization & Analytics at EPFR, uses quantitative analysis to extract value from fund flow and allocations data to help asset managers identify new strategies and detect market opportunities.
Steven works primarily with clients in Asia-Pacific (APAC) markets and U.S. clients investing in APAC markets, helping them mine the firm’s EPFR database of mutual fund and exchange-traded fund flows and positioning data across global markets. He illustrates the predictive power of the data through modelling, based on the distinct mandates of clients.
He specializes in fund flow quantitative strategy development, new data product development, new idea generation and visualization, and research consultation. Previously, he maintained all global asset allocation strategies as well as developed Asia dedicated country and sector strategies from the firm’s Shanghai office.
Steven, a native of China, is a recreational race car driver outside the office whose record speed is 200 mph at the track.
B.S., International Business and Economics - Shanghai University of International Business and Economics.
Master of Finance - Northeastern University.
Certificate in Quantitative Finance (CQF) - Fitch Learning.
“Most people think quantitative analysis is extremely complex. And it is. But sometimes, it’s beautiful in its simplicity. Sometimes, a simple dataset exposes an extraordinary condition lurking just below the surface. And a whole new market strategy emerges.”

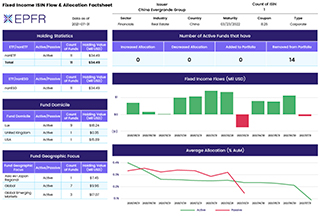
China Evergrande – Fixed on its fate

Quants Corner – When Beijing squeezes, where does the money go?
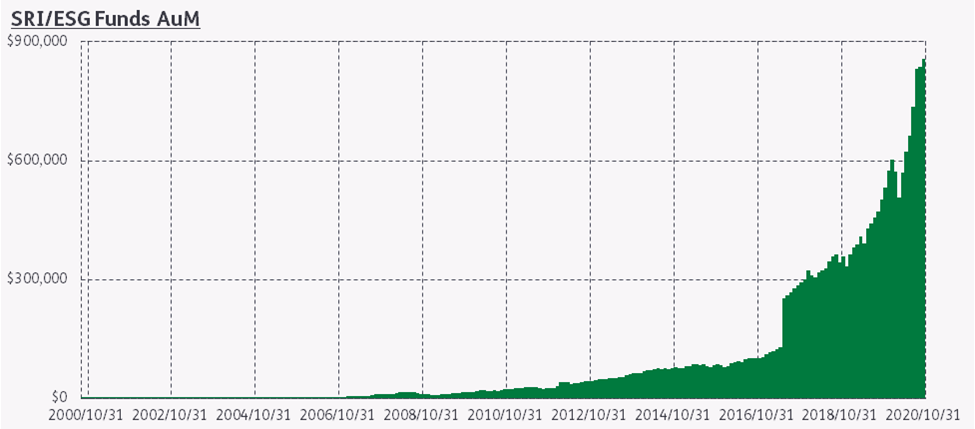
Quants Corner – ESG: The climate has changed
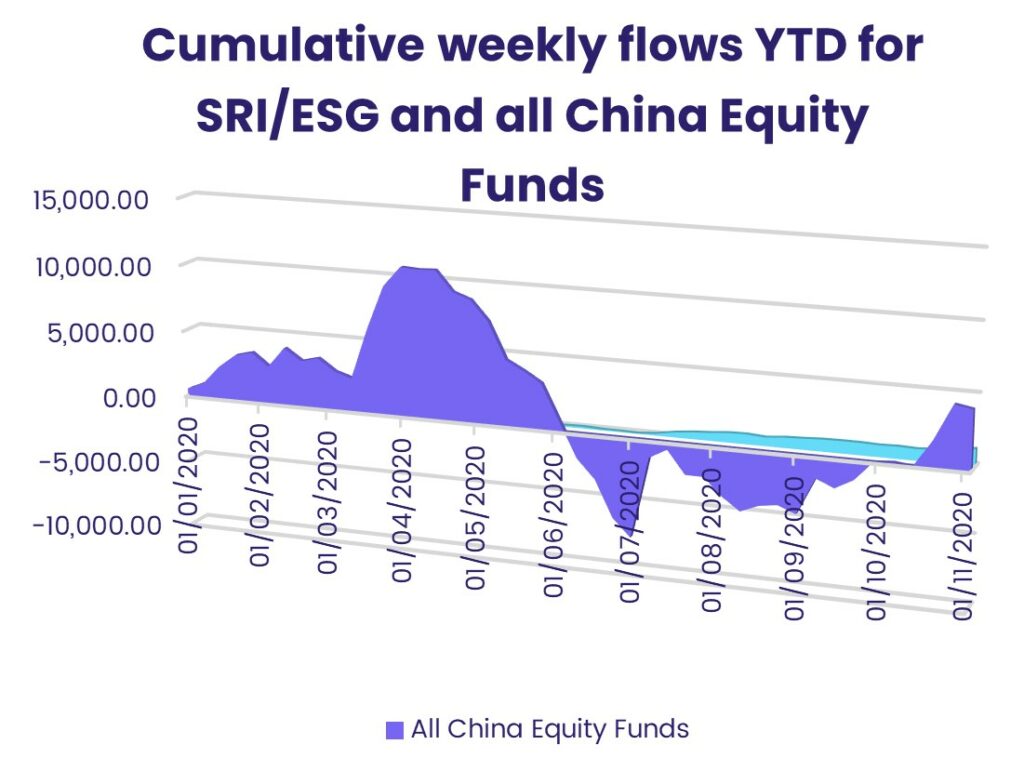
China: Should it be its own asset class? – Webinar
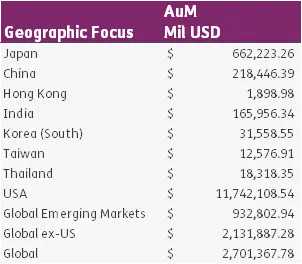
Quants Corner – Japan: Ex-Asia but not ex-Alpha
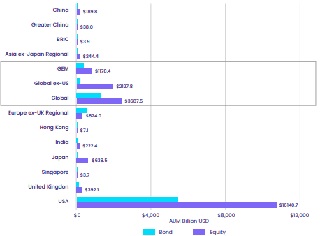
EPFR Papers: China: Should it be in an asset class of its own?
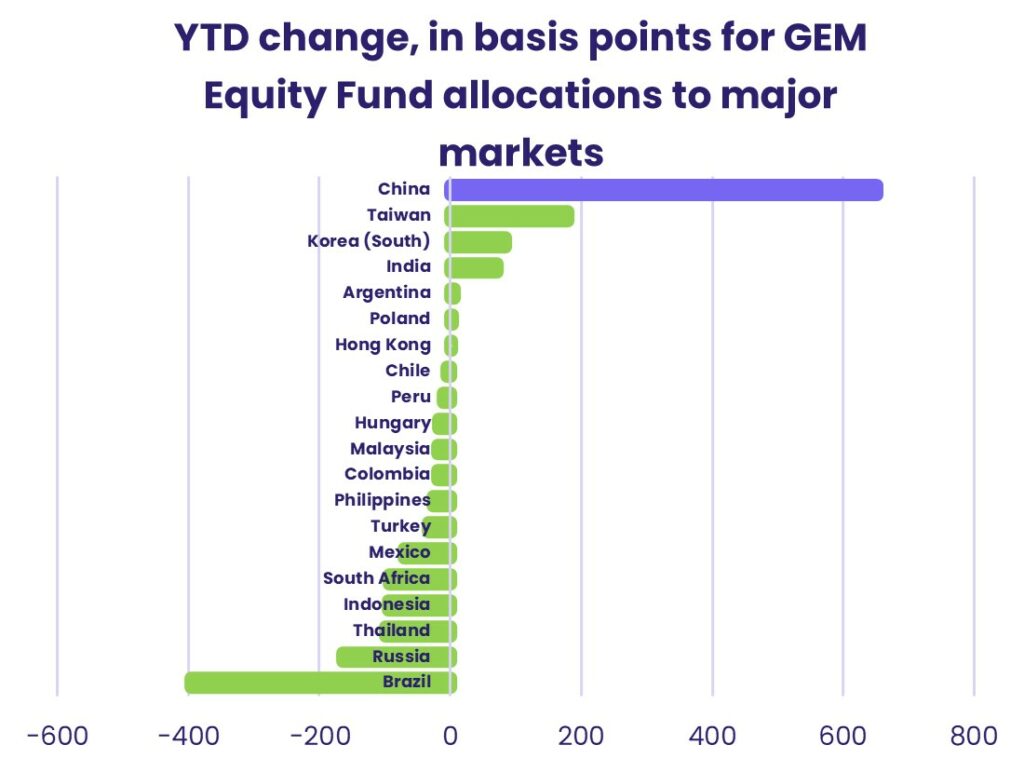
The predictive power of EPFR data: A Quantitative perspective
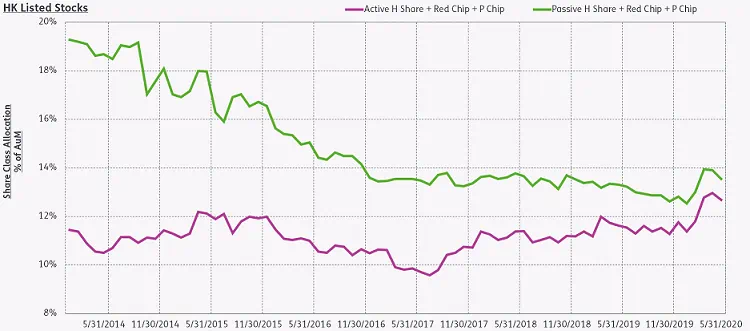
Quants Corner – China share classes: Keep calm and watch letter A
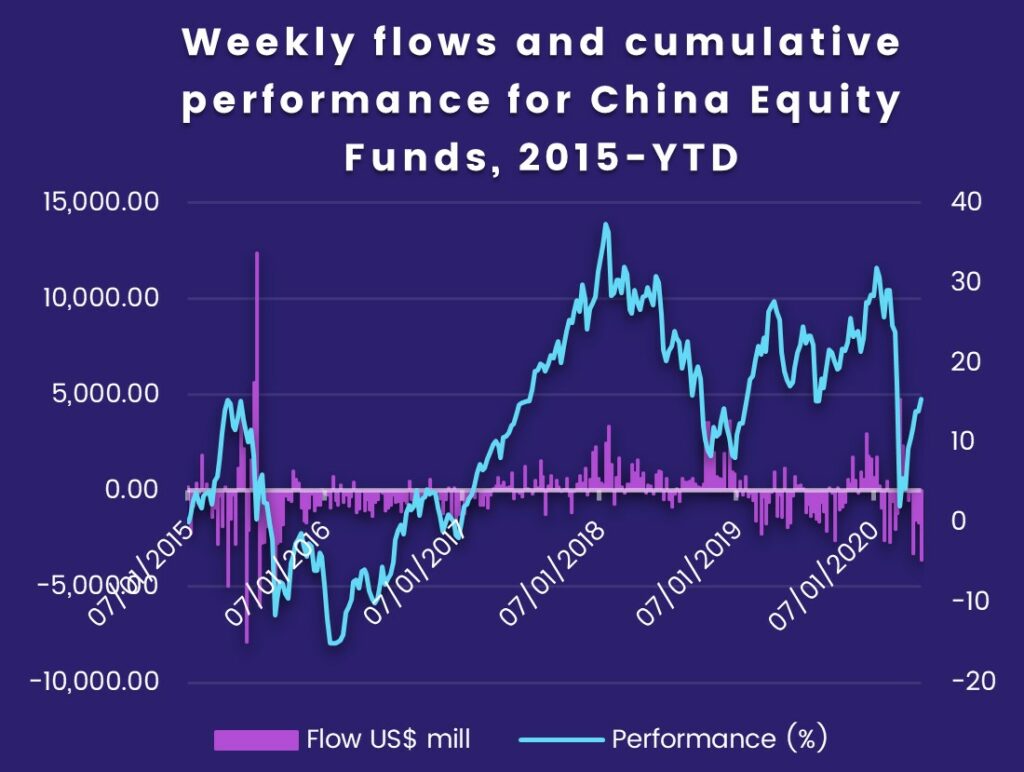
Dealing a full deck: Utilize share classes for reliable China exposure
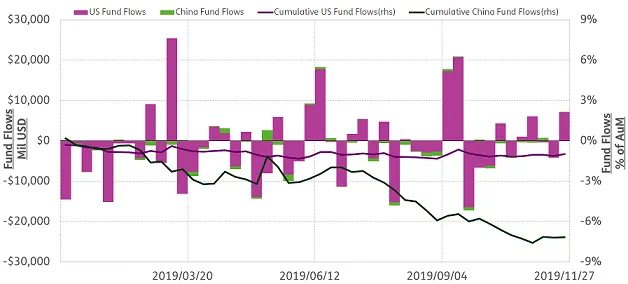
Quants Corner – US vs China trade wars fund flows
