China Equity Funds having absorbed three out of every four dollars committed to EM funds is a startling statistic. The disruptive lockdowns triggered by the country’s zero-Covid strategy, the credit problems of China’s property developers, the regulatory crackdown on the technology sector and the embrace of Russia just before it attacked Ukraine have kept Chinese asset markets under pressure for much of this year. Year-to-date, the collective performance of China Equity Funds lags that of all EM Equity Funds by nearly 10%.
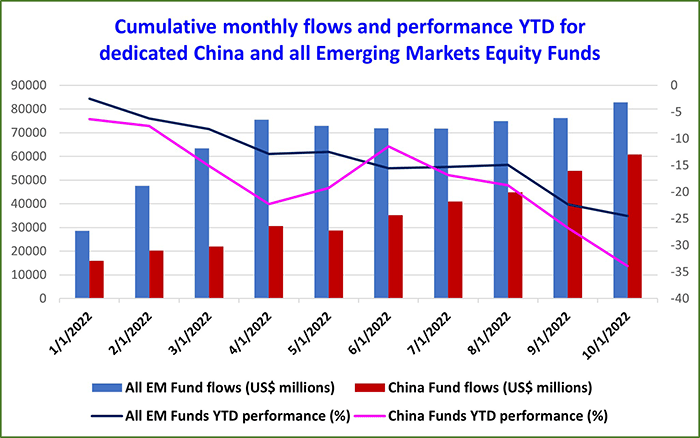
But the bias in flows to China-dedicated funds reflects the willingness of investors to back its domestic demand and ample foreign exchange reserves as a hedge against the market turbulence unleashed by rising US and European interest rate hikes.
How, then, to navigate this fault line between positive flows and negative performance? EPFR’s data provides options for sectoral and stock-level approaches.
Picking the sweetest cherries
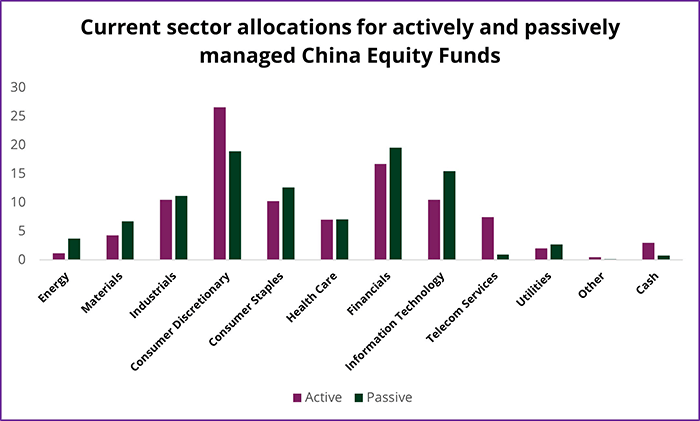
One simple approach is to harness EPFR Sector Allocations data and the ability to filter that dataset by active and passive fund management. Historically, asset classes that are overweighted by active fund managers outperform those favored by their passive counterparts.
As the chart below illustrates, an active versus passive analysis of China Equity Fund allocations shows a strong preference by active managers for the consumer discretionary and telecoms sectors. The former reflects the Chinese government’s stated policy of rotating from exports to domestic consumption. For Chinese telecoms, low valuations and the resiliency of the sector have caught the attention of these managers.
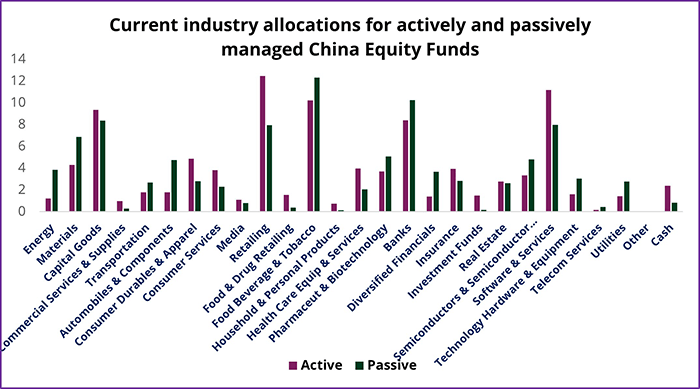
A more granular version of this approach can be taken by leveraging EPFR Industry Allocations data, which tracks fund exposure to 25 industry groups versus the 10 major sectors covered by the Sector Allocations dataset. The chart below shows that, relative to passively managed funds, active managers are currently overweight retail, software, consumer durables and services, capital goods and healthcare equipment.
The basic signal from Industry Allocations data can be refined by calculating the year-to-date change active managers made to their industry exposure and plotting that against the relative weighting versus passively managed funds. Industries that are positive in both categories, which appear in the top right-hand quadrant of the chart below, offer the best chance for capturing industry-level outperformance.
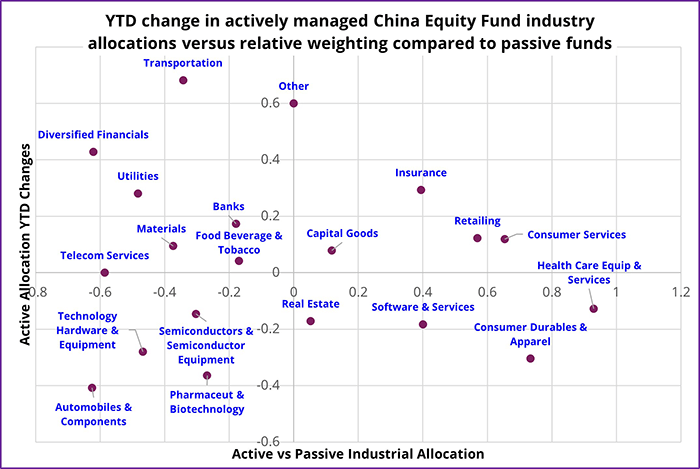
This chart shows that insurance, retailing, and consumer services belong to the group of Chinese industries that have enjoyed both a relative overweight and an increase in their active fund allocations, year-to-date.
Drilling even deeper
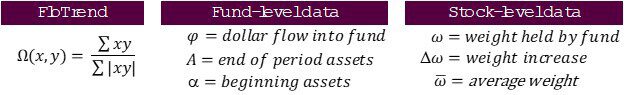
EPFR data also allows users to choose individual stocks using a bottom-up methodology and applying a range of factors. EPFR has developed 13 quantitative factors that are able to capture signals at the stock level and help investors make practical, systematic decisions.
The factors capture a variety of signals from the data. These include investor and manager sentiment, price impact, ownership dispersion and the nature of flows into and out of funds. Our standard back test of the 13 factors, using a simple quintile long-short portfolio framework, shows broadly positive results (see table below).
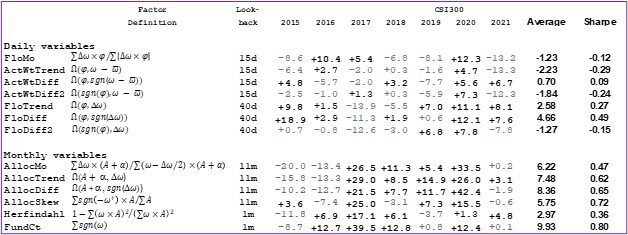
Back testing of the AllocTrend, AlloMo, AllocDiff and AllocSkew factors, which were designed to measure manager sentiment and conviction, prove that the information embedded in the stock level allocation dataset can drive a systematic investment strategy with a Sharpe ratio exceeding 0.6 and an average annual return of more than 6%.
The ownership dispersion factors, which measure the diversification of the company’s ownership, also offer a Sharpe ratio of over 0.8 and an average annual return of over 8% during our entire back test period.
Finding high pressure stocks
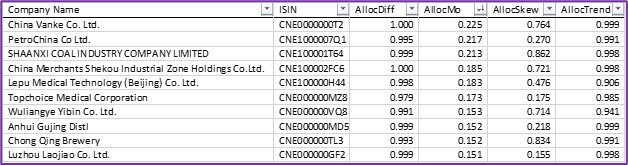
Based on the broad results from our back testing of EPFR’s factors, it makes sense to focus on Chinese companies whose equity has the highest scores from the factors that consistently show outperformance.
EPFR Stock Barometer, which provides the daily and monthly quantitative factor scores for individual stocks, allow us to rank stocks based on those factor scores. If we chose AllocMo as the most significant factor, we get the current ‘Top 10’ for Chinese stocks (see below).
Have we selected the wheat rather than the chaff?
Did you find this useful? Get our EPFR Insights delivered to your inbox.


