Over the past 30 months, inflation – and the efforts of central banks in countries ranging from Turkey to the US to contain it – has dominated the global economic narrative.
Until recently, however, Japan was the notable exception to this storyline. Over the past 25 years, headline inflation exceeded 2% only three times – from September 1997 to March 1998, from April 2014 to March 2015 and since April 2022 – as the country’s policymakers battled persistent deflationary forces.
After literally decades of being on the losing side despite serial, increasingly massive quantitative easing programs, the Bank of Japan (BOJ) has seen inflation take off, hitting a 42-year high of 4.3% in January of this year. It seems that this time, things really are different.
In this Quant’s corner, we will explore whether EPFR’s Fund Flows and Allocation data gave any warning of this sea change in Japanese consumer price inflation (CPI).
Inflation is an active noun
Historically, EPFR’s data has been used to predict future performance at the regional, country, asset class and individual security levels. Little, if any, work has been done to see if investor flow and allocation sentiment data has any utility when it comes to anticipating and gauging inflation.
Our initial investigation utilizes two tools from the EPFR box: cross-border fund flows and one of our in-house quantitative factors, Active Investor Spread (AIS), which measures how much (as a percentage of AuM) active funds are overweight or underweight certain countries compared to their passively managed peers.
As part of its ETFs and Mutual Funds flow data coverage, which encompasses over 150,000 share classes with a collective AuM of $47 trillion, EPFR tracks the country level exposure of a universe of regional equity funds. The data updates on a monthly basis with a 23-day lag. When these regional funds – for instance the iShares MSCI ACWI ETF – adjust their cross-border exposure, it illustrates positive or negative sentiment towards the countries whose allocation is changing.
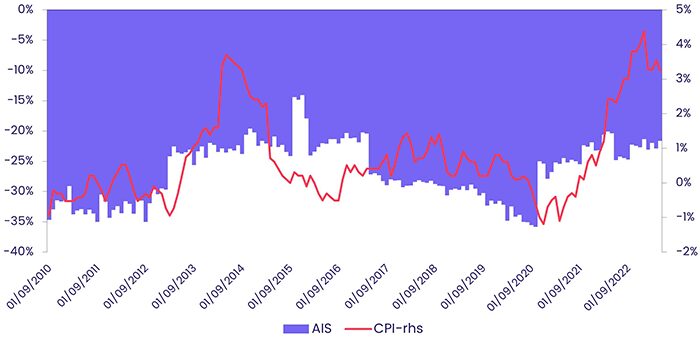
We start off by creating a simple chart (Exhibit 1) that overlays Pacific Regional Funds’ AIS for Japan with Japanese CPI data. Without taking any lags to both country allocation and CPI data into consideration, the concurrent correlation between AIS and CPI stands at 45.4%.
Exhibit 1 – Pacific Regional Funds Active Investor Spread vs CPI (RHS)
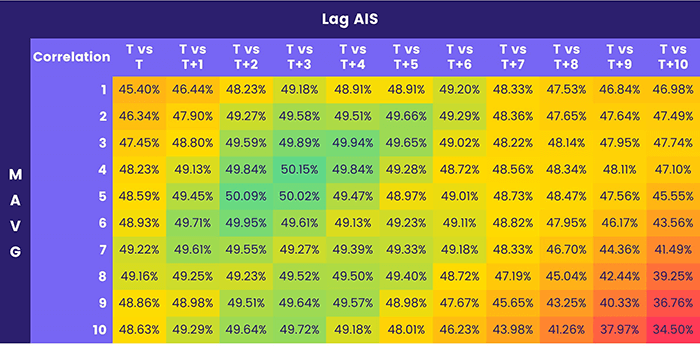
While concurrent correlation looks promising, we wanted to further investigate if a longer moving average window could improve the correlation, and on top of that, to make the analysis more realistic, various monthly lags are applied to AIS.
For example, T vs T+2 means that AIS dated as of two months ago will be used to run correlation analysis against current CPI datapoints. With the help of a heatmap (Exhibit 2), the sweet spot can easily be found through lagging AIS by around 2 to 4 months and using a moving average window of 2 to 6 months, resulting in a better correlation.
Exhibit 2 – AIS MAVG & Lag Window vs CPI correlation heatmap
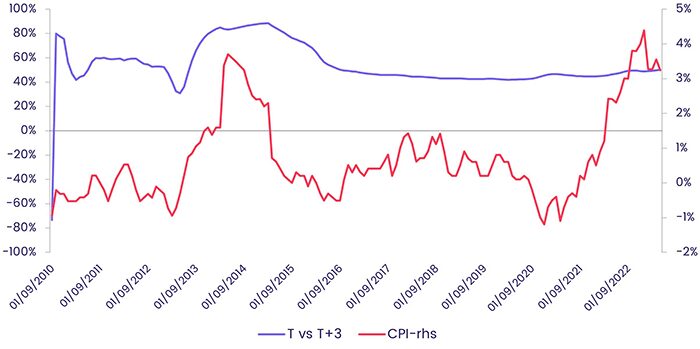
In Exhibit 3 below, the line chart shows a historical rolling correlation (4-month moving average window and 3 months lag applied) vs CPI, and it turns out that the 50% correlation is not just by luck. The rolling correlation has been stable around 50% since Q3 2016, and several major turning points of CPI data have not broken the correlation trends.
Exhibit 3 – Rolling Correlation of 4-Month MAVG lagged 3 Month vs CPI
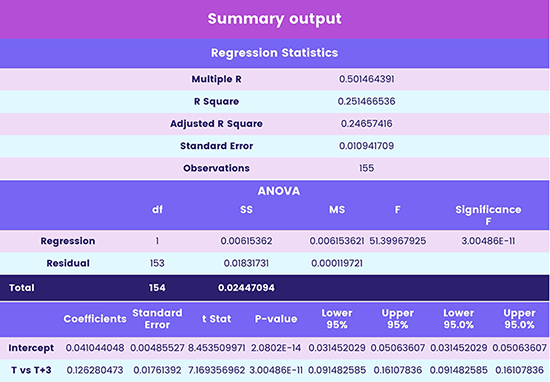
The regression summary output in Exhibit 4 shows details of the regression: AIS is positively correlated with 3-month forward inflation while having a significant T-value.
Exhibit 4 – Regression Summary
This short piece highlighting EPFR’s country allocation driven factor suggests that it adds value to nowcasting or forecasting inflation. Unlocking more value – such as identifying what happened when correlation dropped significantly (2015) or investigating whether such relation happens to other countries – will be explored in future editions.
Did you find this useful? Get our EPFR Insights delivered to your inbox.


