Investors tend to use different playbooks for different market conditions. The tricky part lies in identifying when the market environment has shifted to the point the current playbook needs to be replaced. In this blog, the use of fund flows to detect one of the most important shifts – from a bull to a bear market — is illustrated.
To build the model, we use four data points to characterize each week. These are:
- DM flow – Daily fund flow into developed-market cross-border equities, as a percentage of assets, compounded over the prior four weeks.
- EM ex DM – The difference between daily fund flow into emerging-market and developed cross-border equities, as a percentage of assets, compounded over the prior four weeks.
- Equity ex Bond – The difference between daily fund flow into equities and bonds, as a percentage of assets, compounded over the prior four weeks.
- Volatility – Daily volatility of the Russell 1000 over the prior four weeks.
EPFR began collecting daily fund flows on April 24, 2007. Given that four weeks of data are needed, the very first week in our sample is the one ending May 23 of that same year. The sample ends on July 31, 2019. This allows us to create a matrix out of 2,540 data points (635 weeks times four data points each week) which maps the four dimensions created by the discrete data points into 635 weekly dimensions.
From this matrix we can establish four linear combinations, or vectors, and assign values to them based on the variance in the daily dimensions that they capture, The vector that ‘stretches’ the most becomes the first principle component, with the second-most stretched becoming the second principal component. The least responsive vectors are then discarded, and the two that make the cut are used as the axes that allow us to represent our data in two dimensions by way of a simple dot-plot chart.
Once the dots are arranged along the two axes, we color those that correspond to known bear markets gray. In this case, there is only one in our sample which ran from Oct. 17, 2007 to March 4, 2009. Those that correspond to bull markets are green, with those from the last 10 weeks represented by dark-green triangles. These triangles get larger as the periods they represent approach the present.
The result is a visual representation showing the “center of gravity” for bull markets and a dynamic illustration of where recent data points are in relation to that center.
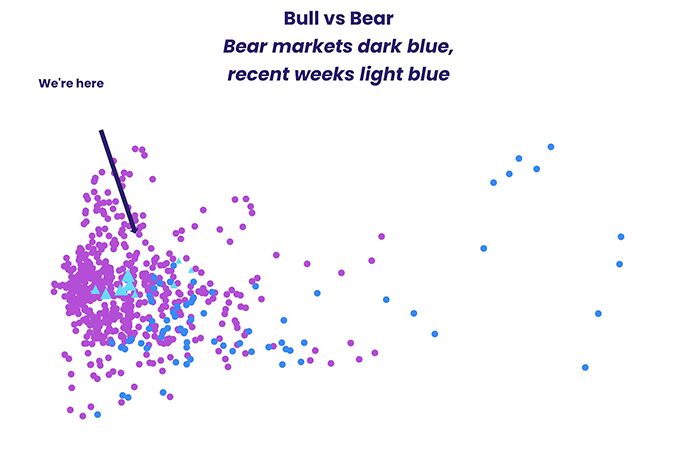
As the exhibit shows, EPFR’s “bear detector’ model currently indicates we are in no imminent danger of falling into a bear market. If anything, the prior ten weeks have seen a march towards safety.
The Fed’s much anticipated 25 basis points rate cut appears to have achieved one of its stated goals – preserving the post-Great Financial Crisis recovery for at least a while longer.
Did you find this useful? Get our EPFR Insights delivered to your inbox.


