Getting good data that produces valid, timely signals is a cornerstone of profitable investing across all asset classes.
Investors, asset managers and other financial professionals focused on foreign exchange have long been hobbled by the dearth of good data in key areas. One such area is the positions that asset managers are building (or shrinking) in foreign markets. As managers change their positions, they create fluctuations in foreign exchange markets due to their changing demand for currencies to establish their positions.
Knowing about these positions is crucial, but the available datasets in the market are generally noisy, imprecise estimates of the actual reality. Some rely on surveys which are prone to biases like representativeness and responsiveness of the respondents. Others rely on the positioning data in exchanges.
EPFR has now begun collecting data on the actual allocations of funds to currencies. It has also been exploring ways to unlock the value of this data. One approach that yields good initial results is a simple one: run with the bulls.
Using the right tools
The new FX Allocations database created by EPFR starts in 2014. As of Q1 2020, it tracks on a monthly basis the allocation of over 1,800 funds to more than 90 different currencies at a monthly frequency. Figure 1 shows the evolution of the number of funds reporting.
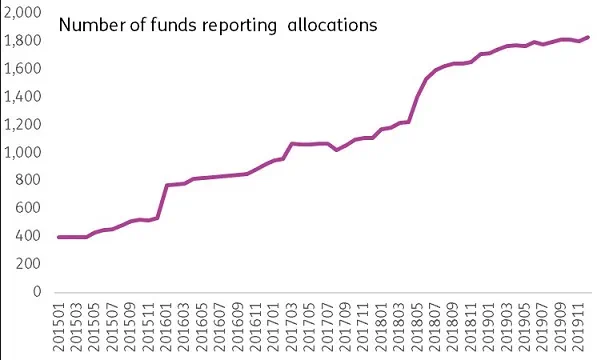
Figure 1: Number of funds reporting FX Allocations
The allocations from this universe of mutual funds and ETFs are obtained from several different sources, including (i) complete portfolio holdings (ii) fund fact sheets (iii) FX allocation reports provided to EPFR by fund managers and (iv) allocations as published on a fund manager’s public website.
FX allocations are the percentage weight that a fund is exposed to each currency through the assets that they hold. EPFR maps each individual security in the file to the currency in which it is traded. For example, in the FX Allocations database an Apple (AAPL) stock would be mapped to the US dollar. In case of Ali Baba Stock, a Chinese company that trades on US exchange, the FX allocation will be again USD.
A similar methodology is used for hard currency bonds. For example, a USD denominated bond of Brazil will be USD allocation, whereas a Brazilian local currency bond of Brazil will be a FX allocation to BRL. Any cash amounts held by the portfolio are also mapped to their respective currency.
If hedges are disclosed in the raw holdings files they show up as negative amounts and are added to the respective currency exposure amounts to get a net exposure percentage allocation. The database includes the positions of equity, bond and multi-asset funds.
Profiting from the numbers
The FX allocation dataset can be used to drive several remunerative quantitative strategies. One them harnesses the bulls.
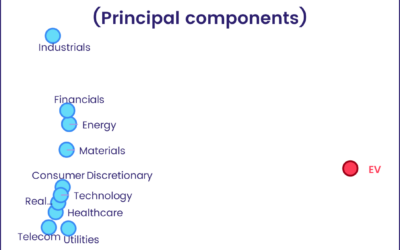
EPFR’s bullish sentiment indicator, applied to currencies, is the percentage of active funds overweight that currency vis-à-vis that fund’s own benchmark. The algorithm is illustrated in Figure-2.
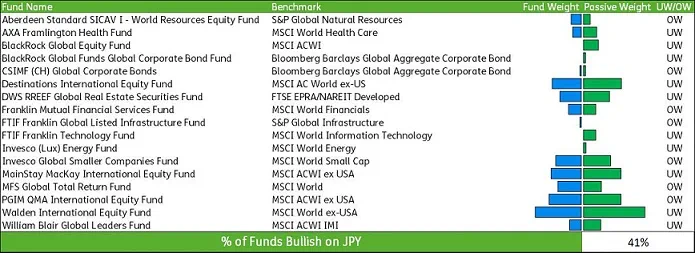
Figure-2: EPFR’s bullish sentiment indicator, the data is for illustration purposes only.
For each fund and currency, the algorithm looks at the corresponding passive benchmark and calculates the active/passive spread of that fund on the selected currency for each month. Then, for each month and currency, the algorithm calculates the percentage of managers who are overweight that currency in the FX Allocations database.
The table below shows the average difference in returns between the top and bottom fifth of EM currencies, sorted based on the latest available bullish indicator, for various holding periods. The strategy is executed by going long the currencies in top quintile and short those in the bottom quintile.
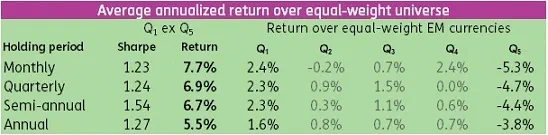
Figure-3: EPFR’s bullish sentiment indicator, the average return difference between the top and bottom fifth of EM currencies
For monthly holding periods, total return differences between the top and bottom fifth of EM currencies, for each calendar year, are reported below.
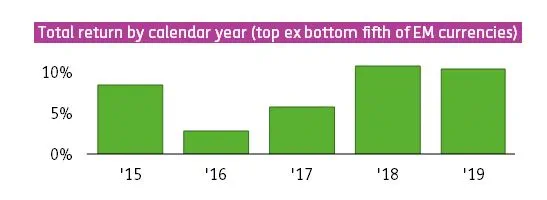
Figure-4: Total return differences between the top and bottom fifth of EM currencies, for each calendar year
As you can see this approach generates good Sharpe ratios – over one for all four durations – and the decay in performance over time is relatively low.
Did you find this useful? Get our EPFR Insights delivered to your inbox.