In-depth research conducted by EPFR’s quantitative team utilizing machine learning algorithms leads us to believe that the answer to this question is, yes, it is entirely possible!
Machine learning algorithms are increasingly important tools for quantitative researchers, allowing the analysis of larger data sets in order to make predictions or conclusions against defined goals.
Utilizing EPFR’s Country Allocations data, our goal was to determine how machine learning algorithms would cluster the data based on the distribution of a fund’s country allocations.
Machine learning clustering algorithms
During the process of answering the question, several machine learning algorithms were tested. The best performing one — for our purposes — was the K-Means algorithm.
K-Means is an unsupervised learning algorithm which is unique, in that its use does not require the subject data to be split into two groups for testing and training. Instead, this algorithm starts by randomly selecting data points for k number of clusters. The algorithm then calculates the centroid of each group and re-clusters the data points based on its shortest Euclidean distance to each centroid. The algorithm runs as many iterations of this step as needed until there is no more change in the groupings of data points. The final output of this algorithm is k clustered groups based on similarities.
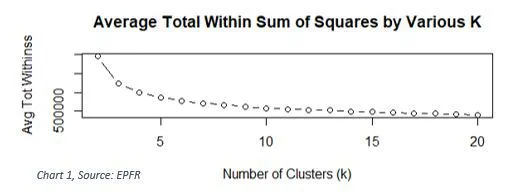
In order to start using this method, the optimal (k) number of groups needs to be determined. Chart 1 is a graph of the Total Within Sum of Squares (TWSS) for k, ranging from 1 to 20, groups. Choosing the smallest value of k that has the smallest TWSS will be the most optimal (k) number of clusters. Therefore, by referring to Chart 1, we can determine that the ideal k value is 3 clusters.
K-Means and the Power of Three
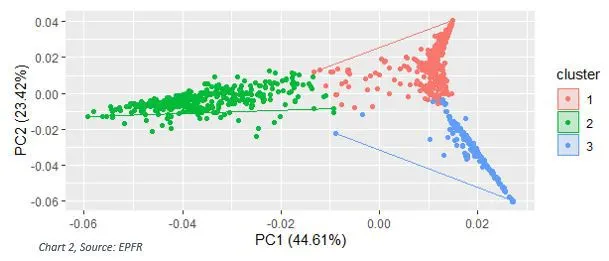
By applying the K-Means Algorithm to EPFR’s Country Allocations data using the optimal k, the desired output of 3 distinct clusters of data were formed based on a fund’s country allocations.
When analyzing the individual data points assigned to each cluster, very clear patterns emerge. For example, Table 1 shows the relationship between each cluster and the asset classes of the funds within it.
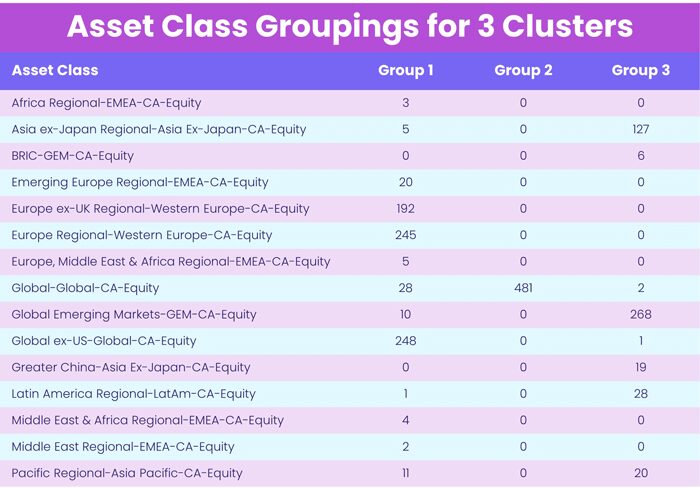
Table 1, Source: EPFR
Some of the trends appearing in the first group are a high count of Global and Europe mandated funds, the second group has strictly Global-dedicated funds, and the third has a mix of funds primarily with Emerging Markets mandates.
This trend was strengthened when investigating the mean country allocations for each of these three groups, which are shown in Table 2.
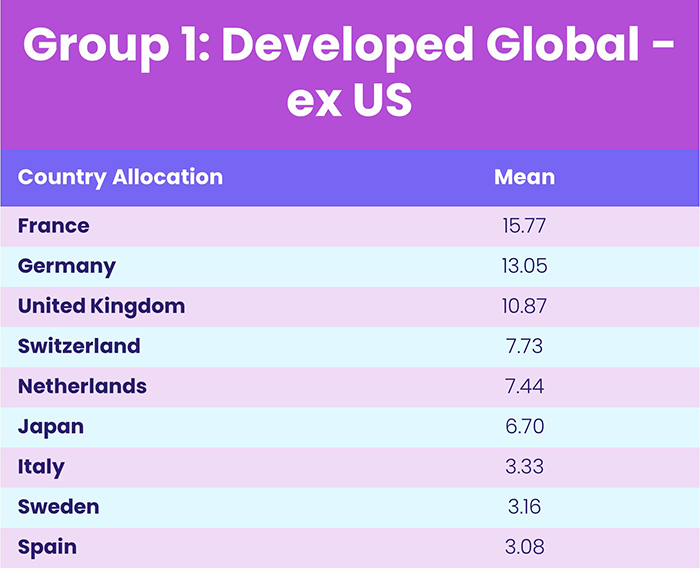
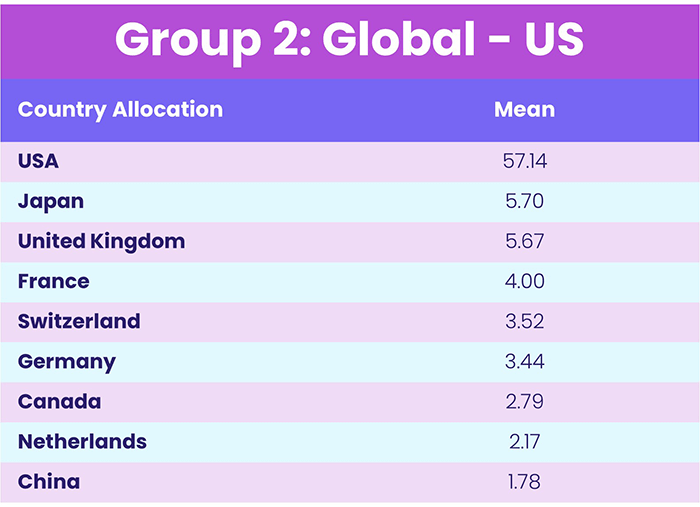
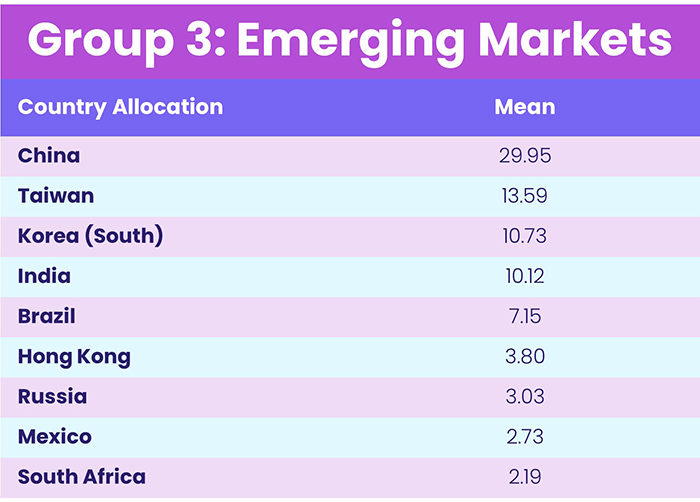 Table 2, Source: EPFR
When looking at the first group’s mean allocations we expected to see a high percentage within funds with Global or European mandates. The highest mean country allocations are from France, Germany, the United Kingdom, Switzerland, and the Netherlands, which gives confidence in assigning the name “Developed Global – ex US” to this first group.
When evaluating the contents within group two, we expected that Global funds would make up the entirety of the cluster. But the mean country allocations of this group were dominated by the US. As a result, we assigned the name “Global – US” to this group.
Finally, with group 3 we expected to see a mix of Emerging Markets countries with high allocations, which turned out to be true. Therefore, group 3 was given the label “Emerging Markets”.
Is four better than three?
When evaluating what happens when the data is split into four clusters (k=4) through this same clustering algorithm, the trend results are predominately the same.
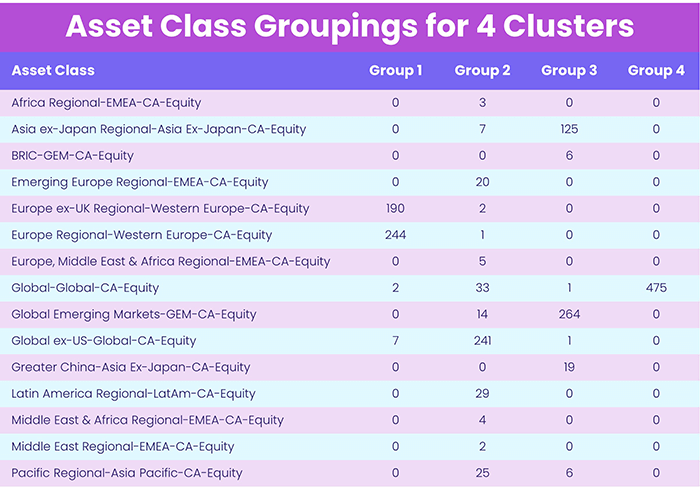 Table 3, Source: EPFR
The only difference in the way the data is split when using k = 4, is that our Developed Global ex-US group, is split into two (Group 1, 2 in Table 4).
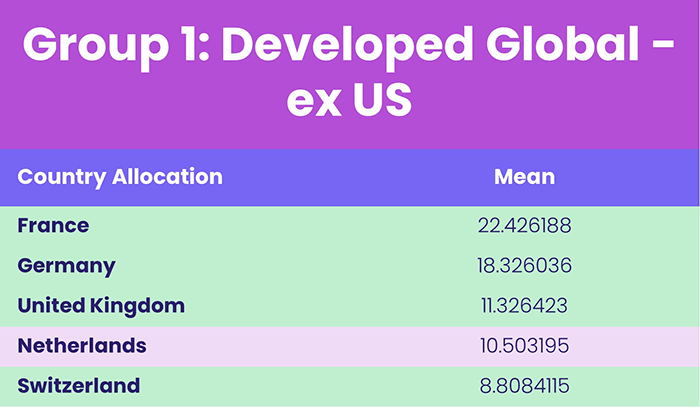
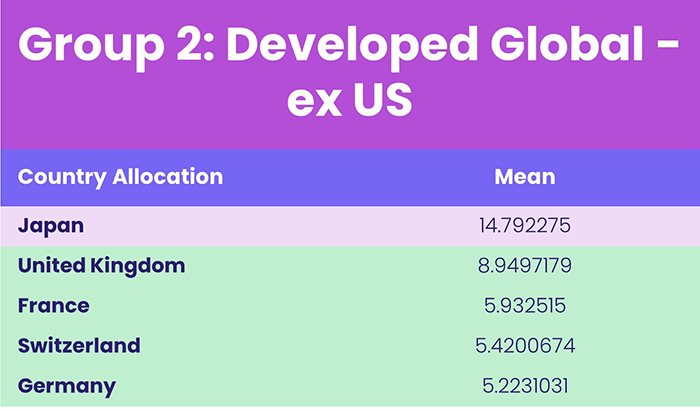
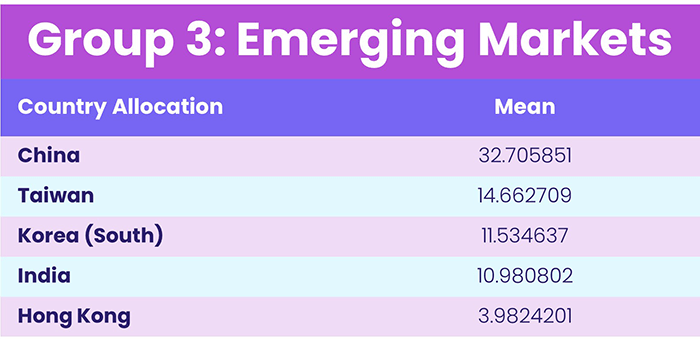
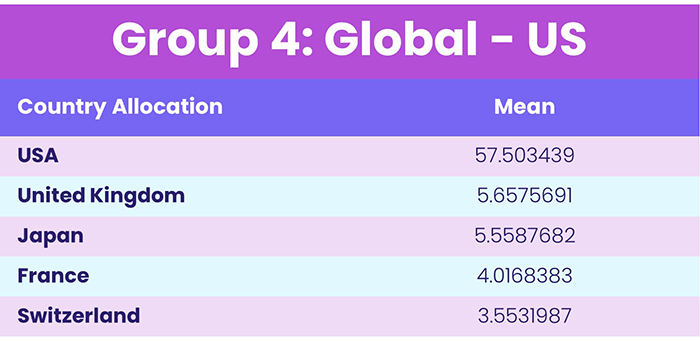 Table 4, Source: EPFR
Since there is considerable overlap between our new groups 1 and 2, there is no significance in adding another cluster to our strategy and thus we choose to continue to use the defined 3 groups.
Strategy Uses
Continuing to explore the three dominant groups of geographic focuses that emerged from the k=3 analysis – Developed Global – ex US, Global – US, and Emerging Markets – the next step is to apply a strategy to the data.
Looking at these groups in tandem with daily data (dating back to 2008), promising returns were yielded using EPFR’s Flow-Percentage Country Strategy. This strategy uses daily percentage flows compounded over a trailing 20-day period, which are then ranked. The weekly results of using this strategy are shown in Table 5.
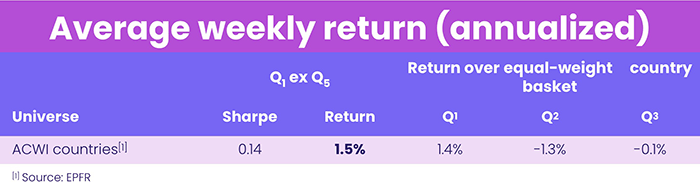 Table 5
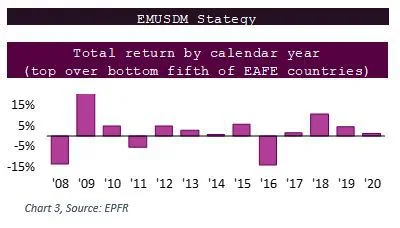
Table 5 shows positive average weekly returns. In addition, Chart 3 shows that these groupings have largely shown positive returns over the years. This is particularly evident during the last four years.
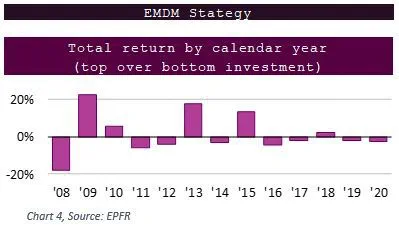
Comparing these results to the Emerging Markets/Developed Markets switch strategy shown in Chart 4, there are mostly negative returns, especially in the most current years.
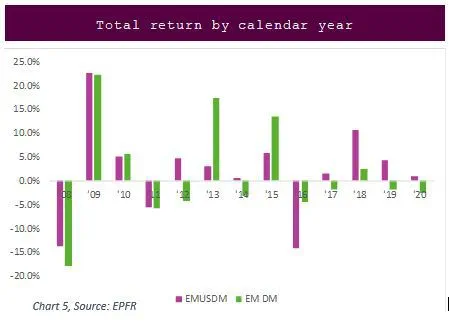
Although the Sharpe ratio (0.14) using Developed Global – ex US, Global – US, and Emerging Markets geo focuses is not particularly high in this case, this strategy still shows promise based on the better returns it has delivered in recent years (shown in Chart 5).
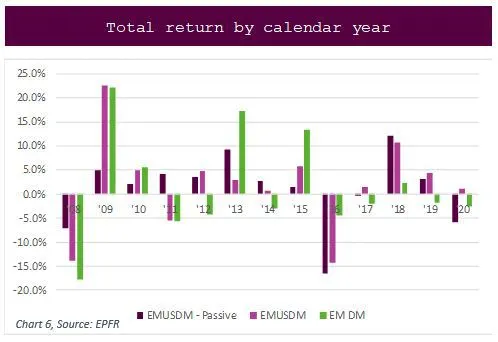
Another option is to use the same strategy but utilize data from passive funds only. The average weekly returns are shown in Table 6.
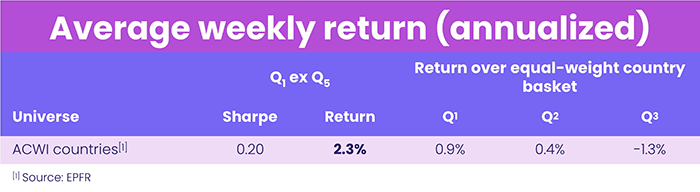 Table 6
The Sharpe ratio for passive funds only (0.20) is better than for all funds. But comparing the yields of all three strategies (see Chart 6) clearly shows the best returns come from using all funds.
Case proven
In conclusion, machine learning algorithms proved very helpful in developing and strengthening our knowledge because of their value in classifying information which can either confirm or reveal a new cluster of data.
Specifically, using EPFR’s Country Allocations data, we were able to confirm that EPFR’s existing geographic focus labels accurately reflect what is in the data, and were able to isolate an additional dominant geo focus group (of Global – US) that could be pulled from the data.
Using this new information gathered from the K-Means algorithm led to an improved strategy. Since machine learning is particularly useful for grouping data into categories, this concept could be explored further with other data sets.
Did you find this useful? Get our EPFR Insights delivered to your inbox.


